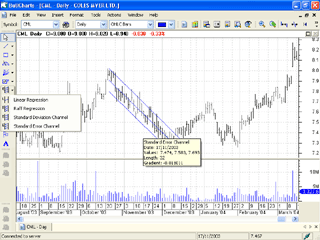
There is a comprehensive range of line study tools in BullCharts. Our innovative line study menus mean you can quickly access every study, while still being able to see meaningful names for each study - rather than just an icon like other programs. Yet another feature to save you time and make life easier.
General purpose studies such as lines are provided for you to draw levels of support and resistance, as well as trends. In addition, many studies are provided to help you implement a specific trading strategy, such as Gann, Fibonacci, count back, and regression tools.
Line Drawing ToolsLine - Horizontal Line - Infinite Line - Interval Line - Parallel Line - Ray Line - Semi Log Line - Vertical Cross Hairs Gann ToolsGann Fan Gann Grid Gann Line Gann Retracements Gann Square Gann Angle Fibonacci ToolsFibonacci Arcs Fibonacci Circles Fibonacci Fan Fibonacci Retracements Fibonacci Spiral Fibonacci Time Zones Fischer’s Ellipse Levels ToolsPrice Extensions Price Retracements Time Extensions Time Retracements Price Time Label Box Time Series |
Cycle ToolsCycle Lines Cycle Analysis Single Cycle Lines RulersPercent Ruler Value Ruler Time Ruler Regression ToolsLinear Regression Raff Regression Standard Deviation Channel Standard Error Channel Data Range ToolsCompound Candle Quadrant Levels Range Info Tirone Levels Geometric ToolsEllipse Parabolic Arc Rectangle Sine Wave Triangle MiscellaneousAndrews’s Pitchfork Count Back Lines Speed Resistance Wormald Triangle Icon Graphic Symbols Trading Note Text Tool |


