Trend Line Indicator Coding
Printed From: BullCharts Forum
Category: BullCharts
Forum Name: BullScript
Forum Discription: Technical discussion related specifically to the BullScript programming language.
URL: http://www.bullcharts.com.au/forum/forum_posts.asp?TID=464
Printed Date: 22 Jul 2026 at 7:31am
Software Version: Web Wiz Forums 9.69 - http://www.webwizforums.com
Topic: Trend Line Indicator Coding
Posted By: RODCAM
Subject: Trend Line Indicator Coding
Date Posted: 04 Mar 2008 at 7:58pm
|
I am trying to build a trendline indicator rather than use the drawing tool but find the example in the manual difficult to understand. It should be relatively simple to input two dates and draw a trendline between the two dates but I can't seem to get my mind around the logic shown in the help manual. Anyone able to give me some guidance? The following is my code: [author=RODCAM; target=price] sdate:= InputDate("Start Date", date(2007,6,30); cdate:= sdate; edate:= InputDate("End Date", date(2008,1,30); xdate:= edate; expr:= expression("Expression",C); period:= sdate=cdate and edate=xdate; [name=Trend; color=blue; width=2] trendline(expr,period,1,0,0) ------------- RODCAM - Brisbane |
Replies:
Posted By: maximo
Date Posted: 05 Mar 2008 at 11:13pm
|
RODCAM i know what you mean.. I did try the trendline business but i think it's probably easier to just input 2 values (beginning and end barnumbers or peaks) and use PREV to draw a straight line between them. Though i got distracted and found some code for Linear Regression Lines for Metastock and used it.. saves time and i can just flick through the charts and see the trend/trendline or channel. {Linear Regression Lines} [target =Price; Color=Orange; Width=2]tp:= Input("Periods",80,2);os:= Input("Offset",0,0);F:= input("Channel (1=On, 0=Off)",1,0);Regline:= Ref((LastValue(Ref(LinearReg(C,tp),-os))-( LastValue(Ref(LinRegSlope(C,tp),-os))*( LastValue(Ref(sum(1),-os))-Ref(sum(1),-os))))+Ref (C,(0-(LastValue(Ref(sum(1),-os))-tp+os)))-Ref (C,(0-(LastValue(Ref(sum(1),-os))-tp+os))),os);if (F=0,Regline,undefined);w1:= lastvalue(hist(HHV(H,5),2))-lastvalue(LLV(L,5));w2:= lastvalue(hist(HHV(H,5),15))-lastvalue(hist(LLV(L,5),15));w3:= lastvalue(hist(HHV(H,5),20))-lastvalue(hist(LLV(L,5),20));w4:=(w1+w2+w3)*.25; if (F>0,Regline-w4,undefined); {upper channel}if (F>0,Regline+w4,undefined); {lower channel}
|
Posted By: RODCAM
Date Posted: 08 Mar 2008 at 2:43pm
|
maximo, thanks that is getting pretty close to the mark on what I wanted and also gives me some 'ideas' on how to approach the other coding exercise. If/when I sort out the other coding approach I'll post the results. Cheers RODCAM ------------- RODCAM - Brisbane |
Posted By: blackdog
Date Posted: 28 Mar 2008 at 12:41pm
|
Rodcam,
So far I have been unsuccessful in using BS to draw automatic trendlines. Amibroker is the only software I know of that can include trendlines in its coding, but you still have to draw them manually first. (Amibroker has a far more powerful scripting lanuage than BS, so maybe just too hard to automate.)
I like Maximos solution using linear regression, it is pretty good approximation for an automatically generated trendline.
BD
|
Posted By: RODCAM
Date Posted: 28 Mar 2008 at 6:25pm
|
I was speaking to a reliable source (who helped me with the step indicator coding to which you also responded ) today who confirmed as much. I was thinking of trying Amibroker but the coding frightened me given BS is relatively simple. Not sure if you have seen the metastocktools.com site which has some excellent coding examples for MS which may be able to be converted to BS (given the coding similarities), but on the surface they are beyond my current capability. This is an example using linear regression channel: { End date point } end:=Year()>EnYear OR (Year()=EnYear AND (Month()>EnMnth OR Month()=EnMnth AND DayOfMonth()>=EnDay)); end:=end AND Alert(end=0,2); end:=If(LastValue(Cum(Ref(end,pds)))=0, LastValue(Cum(1))=Cum(1),end); { Linear Regression Trend/Slope end-points } lastValLRI:=LastValue(Highest( If(end,LinearReg(x,pds),0))); lastValLRS:=LastValue(Highest( If(end,LinRegSlope(x,pds),-10000))); adjust:=LastValue(LastValue(Cum(1)) -Highest(If(end,Cum(1),0))); countback:=LastValue(Cum(1))-Cum(1)-adjust; { Rem next line to extend plot to end of chart } countback:=Ref(Ref(countback,-adjust),adjust); { Lin Reg Trendline } LR:=lastValLRI-lastValLRS*countback; restrict:=adjust-(LastValue(Cum(1))-pds); LRT:=Ref(Ref(LR,-restrict),restrict); { Lin Reg StdDev/StdError channels } bandType:=If(multi>=0,Stdev(x,pds),STE(x,pds)); diff:=ValueWhen(1,Cum(IsDefined(LRT))=1, bandType*Abs(multi)); upLR:=LRT+diff; lwLR:=LRT-diff; { Plot on price chart } upLR;lwLR;LRT Cheers Rod ------------- RODCAM - Brisbane |
Posted By: maximo
Date Posted: 30 Mar 2008 at 3:05am
|
I had a look at that, it's probably meant to a draw linear regression channel with its width based on either Standard Deviation or Standard Error (STE=StEyx in BS), however couldnt get it to work even after adding those other variables. Afterwards I decided to finish the Linear Regression Channel indicator. Because the channel width in it was just a makeshift one, works okay but not very accurate when using an offset value. StdDev and StdErr require too much fidling going from chart to chart so i devised a width system based on Highest High - Lowest Low values. Have a play with it, values 5,10,20 for the width seem to work best. { Linear Regression Channel } [target =Price; lineStyle=Solid; color=orange]tp:= Input("Length",100,2);os:= Input("Offset",0,0);n := input("Width",10,0);Regline:= Ref((LastValue(Ref(LinearReg(C,tp),-os))-( LastValue(Ref(LinRegSlope(C,tp),-os))*( LastValue(Ref(sum(1),-os))-Ref(sum(1),-os))))+Ref (C,(0-(LastValue(Ref(sum(1),-os))-tp+os)))-Ref (C,(0-(LastValue(Ref(sum(1),-os))-tp+os))),os);Width:= Abs(HHV(H,n)-LLV(L,n));CW:= valuewhen(1,Regline,lastvalue(Ref(HHV(Width*0.5,tp),-os)));Regline-CW; {upper channel line}Regline+CW; {lower channel line}
|
Posted By: maximo
Date Posted: 30 Mar 2008 at 9:46pm
|
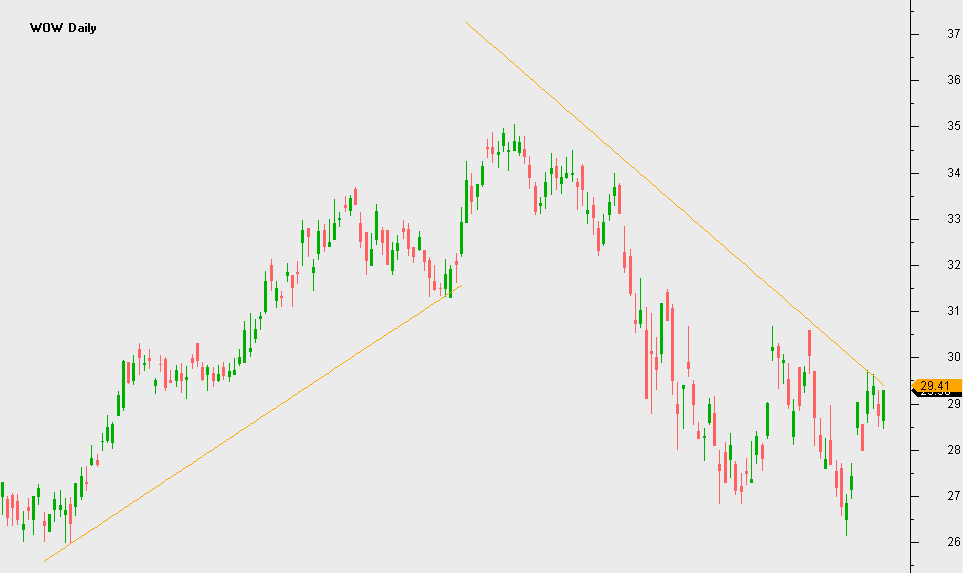
Okay another indicator finished. Does trendlines now, above and below, support or resistance, depending on the trend. Have fun! { TrendLines } [target =Price; lineStyle=Solid; color=orange]tp:= Input("Length",100,2);os:= Input("Offset",0,0);n := input("Width:5=Tight 10=Medium 20=Loose",10,0);Select:= input("Channel=0 Trendline=1",0,0,1);Regline:= Ref((LastValue(Ref(LinearReg(C,tp),-os))-( LastValue(Ref(LinRegSlope(C,tp),-os))*( LastValue(Ref(sum(1),-os))-Ref(sum(1),-os))))+Ref (C,(0-(LastValue(Ref(sum(1),-os))-tp+os)))-Ref (C,(0-(LastValue(Ref(sum(1),-os))-tp+os))),os);Width:= HHV(H,n)-LLV(L,n);lastpoint:= LastValue(Ref(Regline,-os));startpoint:= LastValue(Ref(Regline,-(tp-1)-os));CW:= valuewhen(1,Regline,lastvalue(Ref(HHV(Width*0.5,tp),-os)));UP:= if(lastpoint > startpoint,1,0);if (select=0,Regline-CW,if(UP=1,Regline-CW,undefined));if (select=0,Regline+CW,if(UP=0,Regline+CW,undefined)); |
Posted By: maximo
Date Posted: 30 Mar 2008 at 9:55pm
|
|
Posted By: blackdog
Date Posted: 03 Apr 2008 at 2:56pm
|
Maximo,
You are out doing yourself, given the limitations in BS, this is brilliant coding for a trend line. Results are a bit variable but better than anything else for auto trend lines in BC.
BD
|