NEW Release of BullCharts 3.3
Printed From: BullCharts Forum
Category: BullCharts
Forum Name: BullCharts discussion
Forum Discription: General discussion about getting started with BullCharts and exploring its features.
URL: http://www.bullcharts.com.au/forum/forum_posts.asp?TID=354
Printed Date: 25 Jul 2026 at 7:16pm
Software Version: Web Wiz Forums 9.69 - http://www.webwizforums.com
Topic: NEW Release of BullCharts 3.3
Posted By: Brendon
Subject: NEW Release of BullCharts 3.3
Date Posted: 11 May 2006 at 4:02pm
|
Version 3.3.0 i Significant changes Download from http://www.bullcharts.com.au/Downloads/ - http://www.bullcharts.com.au/Downloads/ Key Features
General
Quick Symbol Search The Quick Symbol Search works when you are not connected to the Internet. It is part of the Security Manager. There is a new tab at the bottom. The Quick Symbol Search allows you to search on a whole word or part of a word. The default is a partial search. Some examples are:
BullScan
BullScript
Indicators
Scans
Bug Fixes
------------- 
|
Replies:
Posted By: chart rider
Date Posted: 15 May 2006 at 5:31pm
|
Brendon How is the 5 pm data update activated? It doesn't seem to work with the "unlimited plus" plan. Thanks |
Posted By: Brendon
Date Posted: 15 May 2006 at 5:36pm
|
We will add in. -------------
|
Posted By: Brendon
Date Posted: 15 May 2006 at 7:30pm
|
It is set correctly. 5pm is done by using the Snapshot option. Then in your scan you set to snapshot to scan on that data. The chart will update with 5pm data automatically. -------------
|
Posted By: Owen
Date Posted: 15 May 2006 at 10:28pm
|
This release seems to be pretty stable. I still cannot view US indices and currency charts, but that's an old problem. File size is 4MB smaller than the previous release, always good to see. 
|
Posted By: chart rider
Date Posted: 16 May 2006 at 5:53pm
|
Owen I have recently tried viewing forex charts, metastock format, with no success - is this the experience you have had when referring to currency charts? CR |
Posted By: Owen
Date Posted: 16 May 2006 at 8:56pm
|
CR, my problem with forex charts occurs in Bulldata mode. When I open a currency chart, all I see is a blank chart. I don't have an forex data source in metastock format so I don't know whether it works or not. |
Posted By: chart rider
Date Posted: 19 May 2006 at 6:16pm
|
Brendon 5 pm update still doesn't work for me, I recieve the message that my plan does not support snapshot update. CR
|
Posted By: Brendon
Date Posted: 22 May 2006 at 5:39pm
|
That has been fixed on the server for the 5pm download. Please try now. -------------
|
Posted By: chart rider
Date Posted: 23 May 2006 at 5:21pm
Yep, works now. Bewdy Newk.
|
Posted By: chart rider
Date Posted: 23 May 2006 at 5:42pm
Nearly works - I can download the snapshot, but am unable to select "use snapshot" on a scan box.
|
Posted By: chart rider
Date Posted: 25 May 2006 at 9:00pm
|
Brendon In the earlier version, when saving a template to the tool bar, a descriptor of more than 3 letters could be used. In the latest version, the descriptor is limited to only 3 characters. Odd. CR |
Posted By: Brendon
Date Posted: 26 May 2006 at 7:43am
|
Yes we had to limit to 3. I will put on the list to see if we use a different way -------------
|
Posted By: michaelandnet
Date Posted: 02 Jul 2006 at 8:00am
|
Brendan, In the indicator area are you looking at adding the optional indicator smoothing for indicators. For Example, similar to that of incredible charts. Regards
Michael |
Posted By: Brendon
Date Posted: 02 Jul 2006 at 9:19am
|
Later it will be a major feature of being able to have an indicator or any indicator.
PS - please update your email address in the forum as it keep sbouncing when you post a message. -------------
|
Posted By: chart rider
Date Posted: 07 Jul 2006 at 7:15pm
|
When displaying a weekly chart, the last bar shows only the data for the last day of the current week, not the full range of data for the week. This happens on all days of the week except at the end of the week. Once all the data for the full week is downloaded, then the last bar becomes correct. I don't recall ever having this problem with the earlier version of BC - anybody else experiencing the same thing? CR |
Posted By: Brendon
Date Posted: 10 Jul 2006 at 9:59am
|
I am not aware of any chnages in this area. I will need to observe. What you are saying is the high/low is for the day not the week? -------------
|
Posted By: Owen
Date Posted: 10 Jul 2006 at 11:13am
I have a different problem. Take ANN for example. It's Monday. On the weekly chart, I can see the last bar incorporates last week's as well as today's information. This applies to both price and volume. Because of this I usually untick the Multiday Dynamic Update.  |
Posted By: chart rider
Date Posted: 10 Jul 2006 at 8:10pm
|
brendon What I get is that the last bar of the weekly chart shows OHLC for the current day, instead of the current week. Wait till mid week, then I can provide an example. CR |
Posted By: chart rider
Date Posted: 12 Jul 2006 at 5:32pm
|
brendon On the weekly chart of AXA below, the last bar is showing information related to today only, instead of all info for the week since Monday,
|
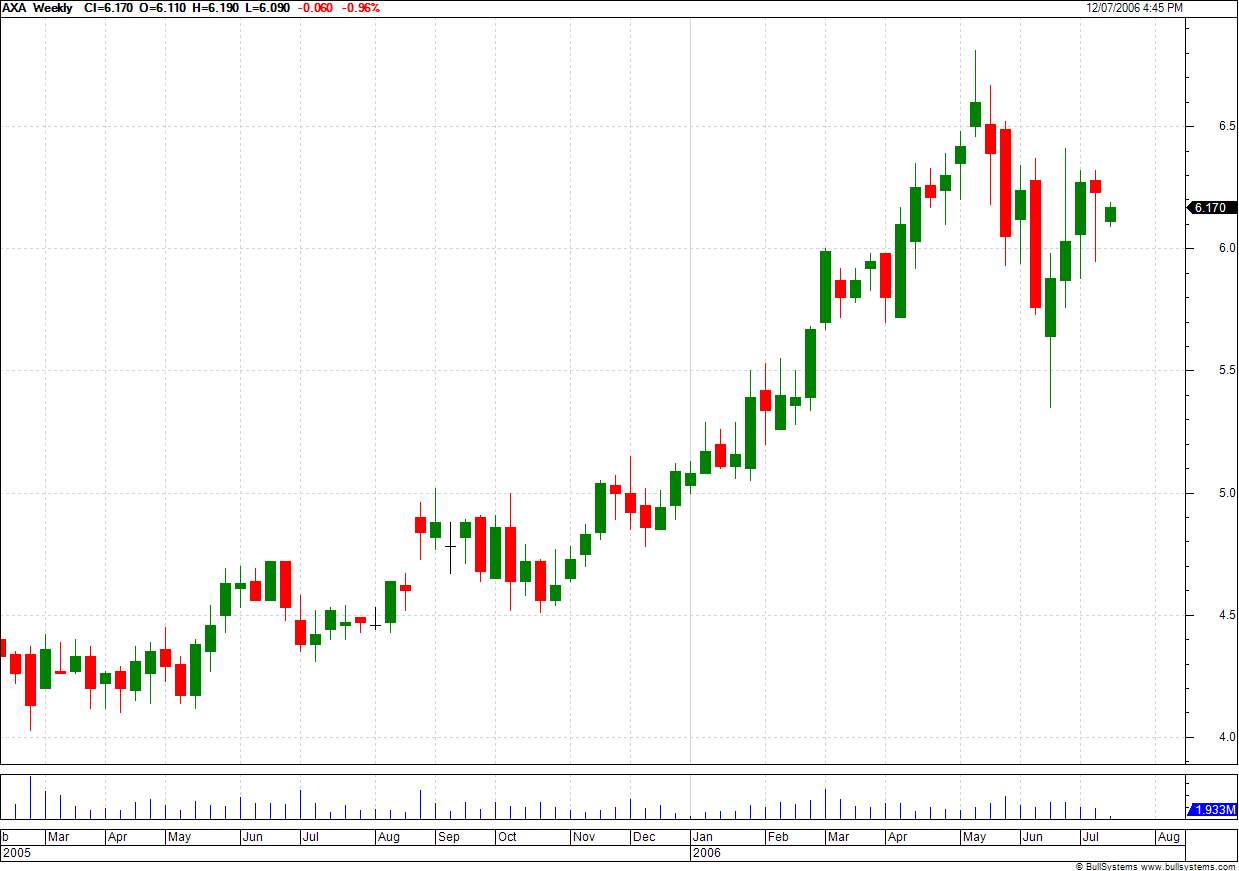
Posted By: Brendon
Date Posted: 12 Jul 2006 at 5:45pm
|
-------------
|
 3.4 due soon has changes for this.
Posted By: chart rider
Date Posted: 03 Aug 2006 at 6:30pm
|
Brendon Was this problem fixed with v3.4.1? The last bar on my weekly charts are still showing only the last days range. CR |
Posted By: Brendon
Date Posted: 03 Aug 2006 at 6:41pm
|
Yes - I see a weekly bar now that is 31 July till 3 August -------------
|
Posted By: chart rider
Date Posted: 03 Aug 2006 at 8:35pm
|
Brendon Looks OK once EOD data is downloaded. The problem perhaps occurs only after the 4.45 snapshot update. I'll check again over the next few days. CR |