J B Volatility Profit taker |
Post Reply 
|
Page <1234> |
| Author |
 Printable Version Printable Version Delicious Delicious Digg Digg Facebook Facebook Furl Furl Google Boomarks Google Boomarks Google Buzz Google Buzz MySpace MySpace Newsvine Newsvine reddit reddit StumbleUpon Translate StumbleUpon Translate Twitter Twitter Windows Live Windows Live Yahoo Bookmarks Yahoo Bookmarks Topic Search Topic Search  Topic Options Topic Options
|
brentjedi 
Regular 

Joined: 13 Dec 2007 Posts: 34 |
 Post Options Post Options
 Quote Reply Quote Reply
 Posted: 14 Dec 2007 at 12:33am Posted: 14 Dec 2007 at 12:33am |
|
Hi Jazza and Ferret
Ferret, I am looking at your entry Berg and also called it the Entry Ferret. Combined with a MACD for confirmation it seems to work if the share trends long. What are the rules when a share price breaks the upper profit band?. Selling on the break seems rash. I am looking to put a 1/2 profit stop under the break bar to see if its got more. Ferret have you created a short version? All the best for the Holidays  Brentjedi |
|
|
Trading is art of self
|
|
 |
|
|
TheFerret
Newbie 

Joined: 18 Aug 2007 Posts: 9 |
Post Options
Quote Reply
Posted: 14 Dec 2007 at 6:42pm |
|
Hey brentjedi,
Yeh look I know what you mean about the profit take. I either close out on the profit take or just ride it until the trade is stopped out by 2 consecutive closes below the trailing stop. But I have closed out trades from the profit take that continue to rocket and I have held on to trades after the profit take signal that just fell away. Neither way is perfect and I tend to judge each trade individually as to which action I will take depending on candle patterns, volume etc. Was it a big move that hit the profit take, then I tend to close it. Or was it small moves that triggered the profit, then I tend to hang on. Maybe your stop is a good idea. As to shorting below is the code, al:= input ("ATR Length",10,1); am:= input ("ATR Multiplier",2,0); use15 := input("Combine with P15 1=yes, 0=no",1, 0, 1); [name=JBPT; color=Orange] pt := ma(L,13,E) - am*ATR(al); pt; [name=Stop; color=Black] ts :=llv(C+2*ATR(al),if(use15,15,1)); ts; [name=fed; color=Red] fd :=hhv(H,20)-2*atr(10); fd; entry := cross((hhv(H,20)-2*atr(10)),C); takeprofit := cross(pt,C); [name=Start; linestyle=marker; marker=type2; tooltip="Volatility Start"] entry; [name=JBPT; linestyle=marker; marker=type1] takeprofit; Note that I am still experimenting with the RSI criteria for overbought. At the moment I am putting an extra horizontal line at 65 on the RSI (C,7) chart as being overbought enough to allow me to take a short position once the start flag is signaled. Also remember the share must be in a falling trend. ie the 34 week EMA must be less than the 34 EMA of 5 weeks ago. Also note that although I included the profit take flag I tend not to use it. And also that it is triggered when price closes below Profit Take and does not appear again until price has move above the profit take. But as I said I rarely use it and prefer on shorts to just ride them until the trade is stopped out by 2 consecutive closes above the trailing stop. Best of luck everyone, Happy Shorting, Merry Christmas and Happy New Year. The Ferret |
|
|
|
|
brentjedi
Regular
Joined: 13 Dec 2007 Posts: 34 |
Post Options
Quote Reply
Posted: 17 Dec 2007 at 1:35am |
|
Hi Ferret
Thanks for sharing. I will play with the short JPT over the weeks, as I am still testing the long JPT. I really like it. Though I have a question on how the short signal is given. Eg the long JPT is across over of the purple line, but the short isn't a cross below the red line?. Cheers Brentjedi |
|
|
Trading is art of self
|
|
|
|
|
TheFerret
Newbie
Joined: 18 Aug 2007 Posts: 9 |
Post Options
Quote Reply
Posted: 17 Dec 2007 at 3:19pm |
|
Dear Bentjedi,
Sorry about that, there is one line of code missing at the front. But use this whole lot here, it has the entry line in purple as well which is easier on the eye. [target=Price] al:= input ("ATR Length",10,1); am:= input ("ATR Multiplier",2,0); use15 := input("Combine with P15 1=yes, 0=no",1, 0, 1); [name=JBPT; color=Orange] pt := ma(L,13,E) - am*ATR(al); pt; [name=Stop; color=Black] ts :=llv(C+2*ATR(al),if(use15,15,1)); ts; [name=fed; color=Dark Orchid] fd :=hhv(H,20)-2*atr(10); fd; entry := cross((hhv(H,20)-2*atr(10)),C); takeprofit := cross(pt,C); [name=Start; linestyle=marker; marker=type2; tooltip="Volatility Start"] entry; [name=JBPT; linestyle=marker; marker=type1] takeprofit; In regards to shorting I actually find I choose a lot of my short positions using the Alan "Hull Actvest Range - Indicator" on daily chart overlayed with the Guppy MMA and the Actvest ROAD in the window above. Regards The Ferret |
|
|
|
|
brentjedi
Regular
Joined: 13 Dec 2007 Posts: 34 |
Post Options
Quote Reply
Posted: 23 Dec 2007 at 12:13pm |
|
Hi Ferret
Can you help me, I am using the Entry Ferret long and trying to get Bullcharts to scan the following 1. a flagged entry on of the purple line where a 1 comes up and Where the MACD is turned up with a 1 flag showing also. I seem to get one or the other but I need both as a entry signal. In regards to the 34 MA compared to the 34MA of 5 weeks ago is that a premade scan?. I am using Hulls Roar of 120 to narrow my scan searches down and then the Entry Ferret to narrow down even more, thus the request about finding only shares with the day signal to buy hit that day or the day before. I can only trade afew stocks at the moment so I need to keep the list short with only the best stocks. If only............... Cheers Best for the Holidays Brentjedi |
|
|
Trading is art of self
|
|
|
|
|
TheFerret
Newbie
Joined: 18 Aug 2007 Posts: 9 |
Post Options
Quote Reply
Posted: 12 Jan 2008 at 2:39pm |
|
Hi, Brentjedi,
Had a busy couple of weeks so no time to reply. Yes the 34MA compared to 34MA of 5 weeks ago is a pre made scan. It is called "JB Rising Trend". In regards to locating when the price closes above the purple entry line, I edited the JB Volatility Profit Taker Scan which as it stands by default only locates when to take profit, not when to enter.(pretty useless if you ask me, as you'd be watching your own shares closely anyway). By default it looks like this: 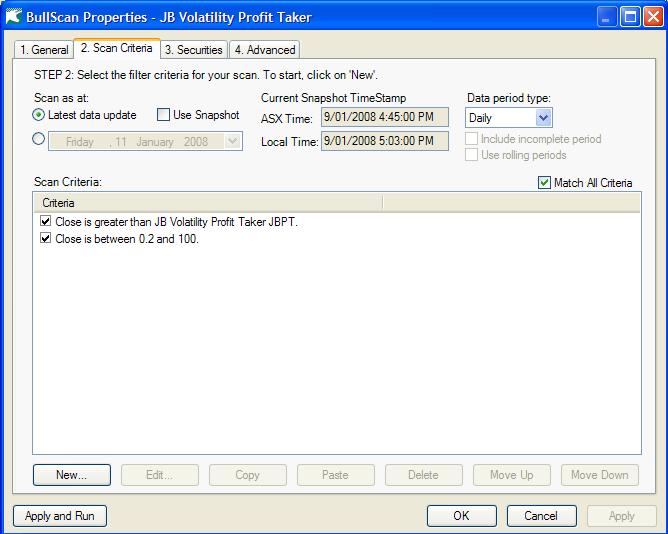 To locate the Ferret Entry points you need to change it so it looks like this: 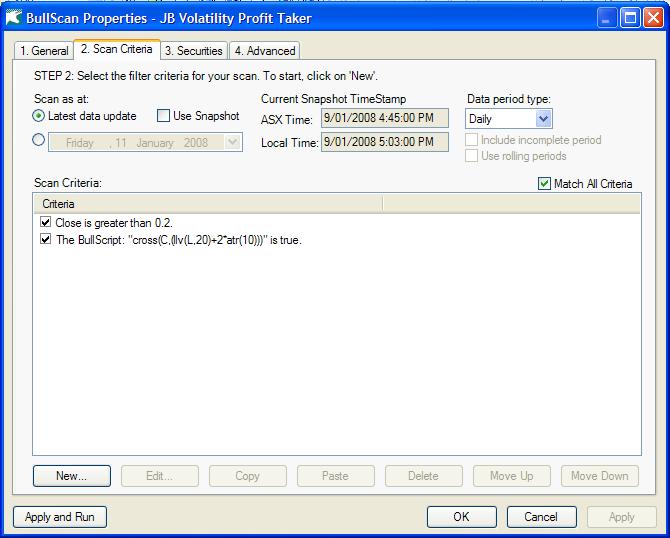 First click once on "close is > than JBVPT" line, then "DELETE" button. Then double click on "close is between 0.2 and 100" and change the comparison to "Greater than". Then OK. (this lets you pick up shares like RIO) Next click the NEW button to add the all important line. Category......"Uses Bullscript" Where it says H+L/2 replace this with cross(C,(llv(L,20)+2*atr(10))) Type of Comparison "is true" Then click OK button Your window should now look like the one above. This scan will find all of your entry ferret points. Now before you add this next bit please read the last paragraph or save what you have as this is a good scan. If you want to add the macd scan to it save what you have done and then create a copy of it and rename it as another scan name. In regards to including a search that also finds when the macd(12,26,9) crosses up, you will need to add another NEW line with the new button. Again Category "Uses Bullscript" Where it says H+L/2 CLICK the Editor button and replace H+L/2 with this: n1 := 12; n2 := 26; ns := 9; r1 := 2/(n1+1); r2 := 2/(n2+1); ma12 := C*r1 + previous(C)*(1-r1); ma26 := C*r2 + previous(C)*(1-r2); res := wait(ma12 - ma26,25); signal := ma(res,ns,E); cross(res,signal) Click OK Then type of Comparison "is TRUE" And there you have it. As to whether you will get any joy from entries using this combination of indicators, I have my doubts. As I have said before the JB entry indicator works only if an oversold signal is also present on the RSI(C,7). What I do is 1. Scan for the ferret entry 2. Scan those scan results with the JB rising scan.( you can do this by selecting securities in the JB rising scan of "Last Scan Results") 3. Scan these results with the premade JB RSI 7 scan. ( you can do this by selecting securities in the JB RSI 7 of "Last Scan Results") that should narrow things down a bit. 4.But remember the Sector should also be in a rising trend. Although You may not find much in the current market and I personally am only Short at the moment. Good Trading The Ferret. Edited by TheFerret |
|
|
|
|
brentjedi
Regular
Joined: 13 Dec 2007 Posts: 34 |
Post Options
Quote Reply
Posted: 13 Jan 2008 at 2:03am |
|
Ferret
Brilliant pure genius.  I added that it must also be above the 200ma to the scan and it is very cool. Got two shares at the end OKN and CPS which is excellent as the market is as you said a short market. So giving only two is excellent. Sir Ferret, Could you please show a screen shot of the actvest/guppy mma setup?. I know of some people using a 15 day breakout or stat crossover to a new low or something along those lines. The Ferret Short code for some unknown reason is not working at the moment BC says its doesn't contain any BC code?. Anyway the market is really sick with little volume. But its not over until the fat lady sings!!!!!!.  Cheers Brentjedi |
|
|
Trading is art of self
|
|
|
|
|
TheFerret
Newbie
Joined: 18 Aug 2007 Posts: 9 |
Post Options
Quote Reply
Posted: 13 Jan 2008 at 4:28pm |
|
Dear Brentjedi,
After writing that post I realised that there is an easier way to do it than what I did.When you add a new line to your scan choose a category of "Is an indicator signal" and then search in the list below for your indicator, In my case it is called "Mitchs JB volatility Entry Only". The parameter button lets you choose the flag(start ,stop, above ,below...) Set Type of comparison is true. You can do the same for the macd. Anyway what I sent you still works even if it is more complicated. In regards to the Actvest Guppy setup, first let me say that I am an Actvest subscriber. The main reason for this is because the newsletter gives me a weekly list of Fundamentally Sound and Fundamentally Unsound Equities which have been generated by StockDocter and I use these as a basis for scans for Long and Short Trades respectively. This is a lot cheaper than subscribing to Stock Doctor. Anyway I have found that using the JB short scan although I use it does not pick up some opportunities that an Actvest Gmma Graph shows me. Example 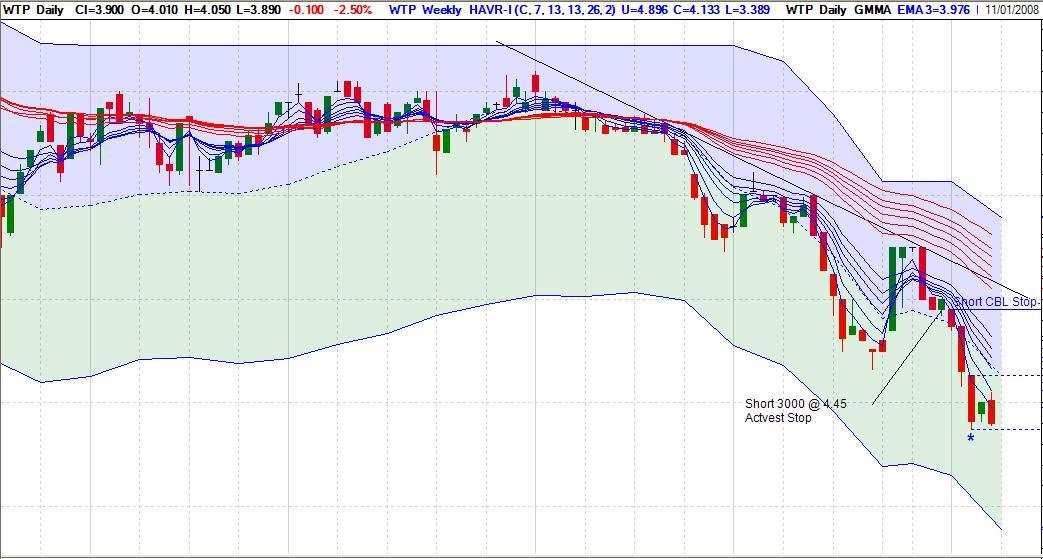 You have to search for the "Hull Actvest Range - Indicator" and "Hull Actvest ROAD" to create a Shorting Actvest Template like this then add the Guppy GMMA over the top of it. Here WTP is on the Actvest list and the Short Term Gmma have retraced back to the LTGMMA rolled back down, and then started to spread.While the price is still in the Actvest Short Zone. The chart without the GMMA does not seem as revealing to me. 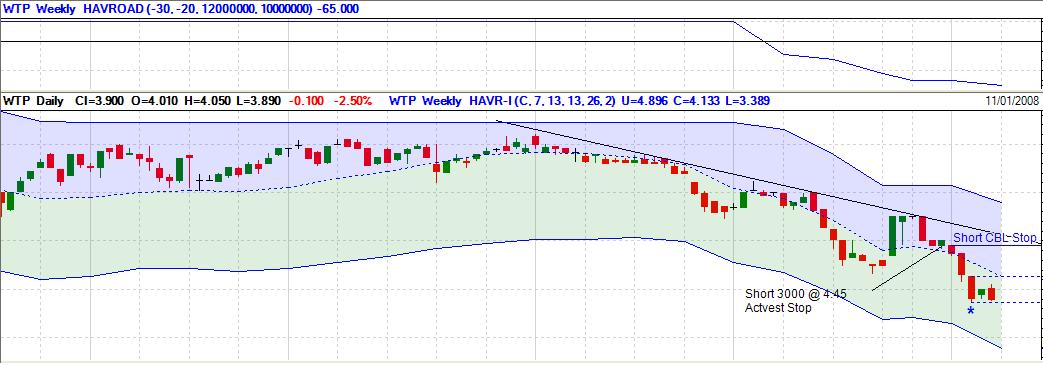 Guppys Trend Trading Book is a good place to start for GMMA analysis as is his weekly newsletter. I also look at Hull Actvest Range + Indicator with the GMMA overlaid for my longs. The JBshort code should be working maybe you have accidently overwritten something. Try recoding it again. Also I don't use that JBRSI 7 scan as I said in the last post because when you are searching for a JB Long and you get a Start signal, At that time the RSI usually is not oversold but it is important that it has recently been oversold. So what I actually do is use steps 1 and 2 as I stated and then visually scan these results looking for a recently over sold condition. Regards TheFerret Edited by TheFerret |
|
|
|
|
maximo
BullCharts Guru 

Joined: 02 Sep 2006 Location: Australia Posts: 232 |
Post Options
Quote Reply
Posted: 14 Jan 2008 at 10:59pm |
|
Hi All, Great to see some active scripters and traders on here :) It's taken me a while to script this due to the way the lines move and dual colouring, but it may be of use to those who use ATR and also trade on the short side. My indicator is good for that and as a trend indicator and stoploss. ATR level is calculted from the median price and has volatility factored in. So have fun with it and let me know what you think. Perhaps they can add it in the next version of BC. Cheers! { Stop Loss & Trend } [Target =Price; LineStyle=Solid; Author=Michael, Max]TDate:= InputDate("Date of trend", date(2007,06,04));HoldingDays:= BarsSince(OnOrSkipped(TDate));V1:= Input("ATR Range",2.5,1);V2:= Input("ATR Periods",4,3);AP:= H/2+prev(O,1)/2;Long:=AP-V1*ATR(V2)* ma(open/hist(open,4),2,W);Short:=AP+V1*ATR(V2)* ma(open/hist(open,4),2,W);LStop := If(Long>PREV and HoldingDays,Long,If(Long<=PREV and HoldingDays,HHV(Long,15),Long));SStop := If(Short<PREV and HoldingDays,Short,If(Short>=PREV and HoldingDays,LLV(Short,15),Short));up:= if(Close<LStop and hist(Close,1) > hist(LStop,1),1,0);down:= if(Close>SStop and hist(Close,1) < hist(SStop,1),1,0);Dtrend:= if(up,1,if(down,0,prev));Utrend:= if(down,1,if(up,0,prev));LongStop := if(Dtrend and HoldingDays,Long,If(Long>PREV and HoldingDays,Long,If(Long<=PREV and HoldingDays,HHV(Long,15),Long)));Shortstop := if(Utrend and HoldingDays,Short,If(Short<PREV and HoldingDays,Short,If(Short>=PREV and HoldingDays,LLV(Short,15),Short)));[drawundefined =gap]init:= if(Dtrend=0 and Utrend=0 and HoldingDays,1,0);[Color =lime green]if (Utrend and HoldingDays and hist(Dtrend,1)=1,LongStop,if(Dtrend and HoldingDays,ShortStop,undefined));[Color =red]if (Dtrend and HoldingDays,ShortStop,if(hist(Dtrend,1)=0 and HoldingDays,LongStop,undefined));[Color =lime green]if (Utrend and HoldingDays or init,LongStop,undefined);
|
|
|
|
|
brentjedi
Regular
Joined: 13 Dec 2007 Posts: 34 |
Post Options
Quote Reply
Posted: 16 Jan 2008 at 10:59pm |
|
Maximo
thanks for sharing, can you run us through the buy and sell signals, or is it just sell under green line and buy over red? will try it and see how it goes Question - too you and Sir ferret, do you use Tradesim? Cheers Brentjedi |
|
|
Trading is art of self
|
|
|
|
|
Post Reply
|
Page <1234> |
| Forum Jump | Forum Permissions You cannot post new topics in this forum You cannot reply to topics in this forum You cannot delete your posts in this forum You cannot edit your posts in this forum You cannot create polls in this forum You cannot vote in polls in this forum |


