Bar Charts and BullScript
Printed From: BullCharts Forum
Category: BullCharts
Forum Name: Tips and Tricks
Forum Discription: Tips on how to use BullCharts more effectively.
URL: http://www.bullcharts.com.au/forum/forum_posts.asp?TID=96
Printed Date: 13 Dec 2025 at 12:37pm
Software Version: Web Wiz Forums 9.69 - http://www.webwizforums.com
Topic: Bar Charts and BullScript
Posted By: Peter
Subject: Bar Charts and BullScript
Date Posted: 06 Jan 2005 at 10:13am
|
The linestyle attribute in BullScript allows a wide variety of styles
to be applied to your formulas. A common representation of a plot is to
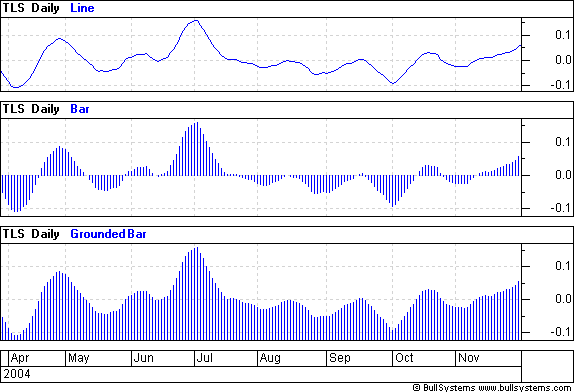
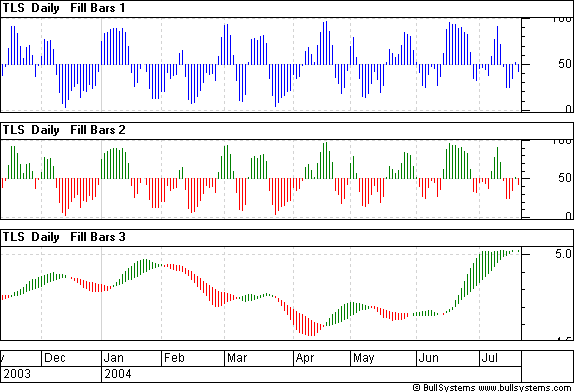
draw it as a bar chart. Figure 1 shows a simple calculation, the difference between two moving averages, drawn using three different line styles. By default it is drawn using a line style (1a). By using the [linestyle=Bar] attribute, a bar chart is drawn that connects each bar to zero (1b). Alternatively the Grounded Bar style draws each bar to the bottom of the pane (1c). Figure 1.  BullScript for Fig 1a ma(C,10)-ma(C,20); BullScript for Fig 1b [linestyle=Bar] ma(C,10)-ma(C,20); BullScript for Fig 1c [linestyle=Grounded Bar] ma(C,10)-ma(C,20); More complicated bar charts are also possible. For example, you may wish to have the bars connect to a value other than zero. This is done in figure 2a, where a stochastic has been drawn with bars connecting to 50. This is possible using the Fill Bar style. The Fill Bar style applies to results in pairs. That is, the two calculations that follow the Fill Bar style both get used in the one plot. A bar is drawn from the first result to the second result. By setting one of the two results to a fixed number (eg 50), the bars will always be connected to that number. Figure 2.  BullScript for Fig 2a [linestyle=Fill Bars] stoch; 50; The Fill Bars line style also allows colours to be applied depending on which of the two results is greater. When we are just using a fixed number as in 2a, this means the colour highlights which side of 50 the bar is on. To apply colours, a colour attribute it put in front of each of the two values. The colour of each bar is whatever the colour of the greater value is. BullScript for Fig 2b [linestyle=Fill Bars] [color=Green] stoch; [color=Red] 50; Whenever the stochastic is higher than 50, the green is used. Whenever 50 is higher than the stochastic (ie the stochastic is below 50), red is used. The Fill Bars style does not require one of the results to be fixed. Figure 2c shows one moving average connected to another. Again, the colour of the higher moving average is shown. BullScript for Fig 2c [linestyle=Fill Bars] [color=Green] ma(C,10); [color=Red] ma(C,20); A number of other fills (such as solid and stepped fills) can be applied in a similar way. The Fill Bar can also be used creatively for other purposes. For example, it is used to draw the left and right edges of boxes in the Darvas boxes indicator. For further information, refer to the LineStyle attribute reference in the BullScript Help for more details. |