J B Volatility Profit taker
Printed From: BullCharts Forum
Category: BullCharts
Forum Name: BullCharts discussion
Forum Discription: General discussion about getting started with BullCharts and exploring its features.
URL: http://www.bullcharts.com.au/forum/forum_posts.asp?TID=433
Printed Date: 25 Jul 2026 at 2:53pm
Software Version: Web Wiz Forums 9.69 - http://www.webwizforums.com
Topic: J B Volatility Profit taker
Posted By: jazza
Subject: J B Volatility Profit taker
Date Posted: 10 Aug 2007 at 11:34pm
|
Hi all, I am fairly
new to Bullcharts and technical analysis. I am
interested in the Jim Berg entry and exit indicator that comes as a standard
template toolbar with Bullcharts. I am especially interested in the breakdown
of the formula. I have cut and pasted the entry bullscript formula as: cross(C,(llv(L,20)+2*atr(10))); My problem is deciphering the bullscript. I am assuming that it is something to do
with the relation of recent Volume, Price lows and average true range. If anyone can decipher the bullscript for
me it would be much appreciated. Cheers, Jazza |
Replies:
Posted By: blackdog
Date Posted: 14 Aug 2007 at 1:47pm
|
Jazza,
You can find more information on bullscript in the help files, but briefly,
llv(L,20) is lowest LOW price Value in last 20 bars.
ATR(10) is average true range for the last 10 bars
cross(C,X) is true when Close price is higher than X for the current bar but not on the previous bar.
|
Posted By: jazza
Date Posted: 14 Aug 2007 at 10:33pm
|
Thanks blackdog, Still a bit confused as to why the JB entry appears when it does, ie sometimes on a price dip, sometimes on a rise. Sometimes working sometimes stopping out all the time. A bit like a stopped watch that is right twice a day! A bit harsh because it seems like quite a good entry indicator. If you have any other info on the JB reasoning it would be much appreciated. Thanks, Jazza |
Posted By: TheFerret
Date Posted: 18 Aug 2007 at 5:59pm
|
The thing with JB Volaitity is before you can use the Entry signal 3 other criteria must be satisfied. 1. The Sector must be in a rising trend 2. The share must be in a rising trend 3. The share must be recently oversold below the 30 line on the RSI chart for JBV indicator. Then and only then when the Entry Flag comes up (i.e. the share price close above the formulae you mentioned or better still the bar changes from red to blue {as sometimes the entry flag won't come up if it has come up recently and thinks the trade is still open}) then and only then can you enter the trade at a price of 1. no more than the closing price of that day (it may take a few days for your order to be filled, be patient), and 2. no more than 10% from the lowest price of the recent oversold condition. For example if the recent low of the oversold was at $1.00 then you can only enter on an entry signal that closes at or less than $1.10. This close should preferably be on a rising day also. Note: That when I say the share and Sector should be in a rising trend this can be identified using the bullcharts JB scan called JB rising trend, which basically checks that todays exponential 34 day MA is greater than the exponential 34 period MA of 5 days ago. You can plot these lines on your JB chart to make this obvious with out doing the scan. The last thing is if the S&P 500 and XJO are behaving with extreme volatilty it may be wise to wait until things have settled down. Hope this helps. Good Trading. The Ferret. |
Posted By: TheFerret
Date Posted: 21 Aug 2007 at 6:21pm
|
Correction: The share and sector must be in a rising trend on the weekly chart i.e this weeks 34 week EMA is greater than the 34 week EMA of 5 weeks ago. Then you enter using the daily charts Entry signal. |
Posted By: jazza
Date Posted: 31 Aug 2007 at 1:18pm
|
Hi Ferret, Thanks very much for taking the time to explain the criteria of The JB indicator. Very much appreciated even if it has taken a couple of weeks to reply! Wanted to check out the added conditions of entry in relation to chart history of various stocks. Interestingly it seems that a lot of good trades are missed by not allowing to buy the stock if it is above the previous days close. Seems that you miss out on a lot of profitable trades even if they are not long term. Also having to have the RSI below 30 also seems to restrict more good trades and even harder to get the RSI below 30 when you also need the 34 weekly EMA to be higher than 5 weeks ago. I assume that this is a safety measure by having these 3 extra factors in your favour for a higher probability chance of reasonable profit. Do you know if the JB can be used intraday? And thanks also for the tip about staying out while extreme volatility reigns with the markets! Cheers, Jazza |
Posted By: TheFerret
Date Posted: 04 Sep 2007 at 5:43pm
|
Dear Jazza, In regards to not entering above the closing price of the Entry Signal, the JB profit Taker as it stands was developed for end of day trading and you do find that if you keep your order inmarket for a few days it will usually but not always be filled. However if you have the time to watch the last hour of the days trading you can enter on the day of the entry signal if you know when an entry signal will be generated. I do this by plotting the line EntryLine := llv(L,20)+2*atr(10); on the chart. Everytime the close of the day moves from below this line to above, an entry flag is generated on the chart. So you can make an educated guess as to whether todays close will generate an entry signal based on the end of day price activity. There is one more thing about the Bullcharts Entry/Profit Take/Stopped out flags, that you should be aware of. And that is that they represent a completed trade from start to finish. And once a Start Flag has been Generated No other Start Flags will be generated until either a Profit Take or Stopped Out Flag has been Generated. BUT there usually are other positions in which a Start Flag is Valid for entering the trade and often these are in a better position with regard to the RSI oversold. Basically if you look at the default BERG chart everytime the berg candle changes from RED to BLUE indicates a possible start. Personally what I did is create an indicator using the following code and called it JBEntry Only [target=Price; author=Berg, Jim; category=Stop Loss|Volatility] al := input("ATR Length", 10, 1); am := input("ATR Multiplier", 2, 0); use15 := input("Combine with P15 1=yes, 0=no", 1, 0, 1); [name=JBPT; color=Orange] pt := ma(H,13,E) + am*ATR(al); pt; [name=Stop; color=Black] ts := hhv(C-am*ATR(al),if(use15,15,1)); ts; [name=EntryLine] [color=Dark Orchid] EntryLine := llv(L,20)+2*atr(10); EntryLine; entry := cross(C,(llv(L,20)+2*atr(10))); takeprofit := true; stopped := true; inMarket := if (entry, true, if (takeprofit or stopped, false, prev)); [name=Start; linestyle=marker; marker=type1; tooltip="Volatility Start"] inMarket and not hist(inMarket,1); Then I go back to my charts and bring up the default BERG chart. Click on the chart on the profit taker line then Delete Key. Then I click on add an indicator at the bottom of the screen and select my new indicator JBEntry Only. Then as I prefer candles I change the bars to candlesticks. Doubleclick on a candle and change the color to "Price change since open". I then "Save as Template" from the file menu to a new name such as "Volatility Entry.bct". Then click on customise templates at the bottom of the screen and ADD, choose "Volatility Entry.bct" and give it a 3 letter abbreviation suchas VEP and there you have a new template that you can use to predict POSSIBLE entries. I say POSSIBLE because remember all the other entry criteria must also be true, RSI OVERSOLD , RISING STOCK RISING SECTOR. As profit taking flags only occur when closing price is greater than the profit taker plot, I don't include these flags. As Stop Loss flags only occur when closing price is below the stop loss line for 2 consecutive days I also do not clutter up my chart with this info. You should also be aware that you can do 2 styles of trading the JB. Short Term which we have discussed and Long Term where the entry is the same but you never take profit and you switch to a weekly chart once you switch from your initial stop to a trailing stop and only close out you position if the stock closes below the stop on the weekly chart for 2 consecutive weeks or the Major indices are behaving with extreme volatility. eg now. Finally you can get lots of useful info from www.sharescene.com in the ask Jim Berg section and even ask Jim questions, a truly valuable resource and free. As for using JB intra day I don't know. I am however trying to create a JB for shorting. Regards theferret |
Posted By: jazza
Date Posted: 06 Sep 2007 at 11:46pm
|
Hi ferret, You are
extremely generous with you time and info. Just finished reading your post and
that�s a lot of interesting material to digest. Will work on it over the next
several days and let you know how I get on. Thanks,
Jazza |
Posted By: jazza
Date Posted: 02 Oct 2007 at 11:33am
|
Hi, Ferret, A word of
thanks. Have been using your JB entry only indicator for several weeks now.
It�s an excellent tool as it allows you to visually track your watch list and
know how close or far your various shares are from the entry line. I have the indicator
as a stand alone Indicator and also added it to the JB Volatility Template. The
indicator has been immortalized as the Ferret indicator! Cheers, Jazza |
Posted By: TheFerret
Date Posted: 02 Oct 2007 at 4:28pm
|
Thanks! Glad to be of help, regards The Ferret |
Posted By: brentjedi
Date Posted: 14 Dec 2007 at 12:33am
|
Hi Jazza and Ferret Ferret, I am looking at your entry Berg and also called it the Entry Ferret. Combined with a MACD for confirmation it seems to work if the share trends long. What are the rules when a share price breaks the upper profit band?. Selling on the break seems rash. I am looking to put a 1/2 profit stop under the break bar to see if its got more. Ferret have you created a short version? All the best for the Holidays  Brentjedi ------------- Trading is art of self |
Posted By: TheFerret
Date Posted: 14 Dec 2007 at 6:42pm
|
Hey brentjedi, Yeh look I know what you mean about the profit take. I either close out on the profit take or just ride it until the trade is stopped out by 2 consecutive closes below the trailing stop. But I have closed out trades from the profit take that continue to rocket and I have held on to trades after the profit take signal that just fell away. Neither way is perfect and I tend to judge each trade individually as to which action I will take depending on candle patterns, volume etc. Was it a big move that hit the profit take, then I tend to close it. Or was it small moves that triggered the profit, then I tend to hang on. Maybe your stop is a good idea. As to shorting below is the code, al:= input ("ATR Length",10,1); am:= input ("ATR Multiplier",2,0); use15 := input("Combine with P15 1=yes, 0=no",1, 0, 1); [name=JBPT; color=Orange] pt := ma(L,13,E) - am*ATR(al); pt; [name=Stop; color=Black] ts :=llv(C+2*ATR(al),if(use15,15,1)); ts; [name=fed; color=Red] fd :=hhv(H,20)-2*atr(10); fd; entry := cross((hhv(H,20)-2*atr(10)),C); takeprofit := cross(pt,C); [name=Start; linestyle=marker; marker=type2; tooltip="Volatility Start"] entry; [name=JBPT; linestyle=marker; marker=type1] takeprofit; Note that I am still experimenting with the RSI criteria for overbought. At the moment I am putting an extra horizontal line at 65 on the RSI (C,7) chart as being overbought enough to allow me to take a short position once the start flag is signaled. Also remember the share must be in a falling trend. ie the 34 week EMA must be less than the 34 EMA of 5 weeks ago. Also note that although I included the profit take flag I tend not to use it. And also that it is triggered when price closes below Profit Take and does not appear again until price has move above the profit take. But as I said I rarely use it and prefer on shorts to just ride them until the trade is stopped out by 2 consecutive closes above the trailing stop. Best of luck everyone, Happy Shorting, Merry Christmas and Happy New Year. The Ferret |
Posted By: brentjedi
Date Posted: 17 Dec 2007 at 1:35am
|
Hi Ferret Thanks for sharing. I will play with the short JPT over the weeks, as I am still testing the long JPT. I really like it. Though I have a question on how the short signal is given. Eg the long JPT is across over of the purple line, but the short isn't a cross below the red line?. Cheers Brentjedi ------------- Trading is art of self |
Posted By: TheFerret
Date Posted: 17 Dec 2007 at 3:19pm
|
Dear Bentjedi, Sorry about that, there is one line of code missing at the front. But use this whole lot here, it has the entry line in purple as well which is easier on the eye. [target=Price] al:= input ("ATR Length",10,1); am:= input ("ATR Multiplier",2,0); use15 := input("Combine with P15 1=yes, 0=no",1, 0, 1); [name=JBPT; color=Orange] pt := ma(L,13,E) - am*ATR(al); pt; [name=Stop; color=Black] ts :=llv(C+2*ATR(al),if(use15,15,1)); ts; [name=fed; color=Dark Orchid] fd :=hhv(H,20)-2*atr(10); fd; entry := cross((hhv(H,20)-2*atr(10)),C); takeprofit := cross(pt,C); [name=Start; linestyle=marker; marker=type2; tooltip="Volatility Start"] entry; [name=JBPT; linestyle=marker; marker=type1] takeprofit; In regards to shorting I actually find I choose a lot of my short positions using the Alan "Hull Actvest Range - Indicator" on daily chart overlayed with the Guppy MMA and the Actvest ROAD in the window above. Regards The Ferret |
Posted By: brentjedi
Date Posted: 23 Dec 2007 at 12:13pm
|
Hi Ferret Can you help me, I am using the Entry Ferret long and trying to get Bullcharts to scan the following 1. a flagged entry on of the purple line where a 1 comes up and Where the MACD is turned up with a 1 flag showing also. I seem to get one or the other but I need both as a entry signal. In regards to the 34 MA compared to the 34MA of 5 weeks ago is that a premade scan?. I am using Hulls Roar of 120 to narrow my scan searches down and then the Entry Ferret to narrow down even more, thus the request about finding only shares with the day signal to buy hit that day or the day before. I can only trade afew stocks at the moment so I need to keep the list short with only the best stocks. If only............... Cheers Best for the Holidays Brentjedi ------------- Trading is art of self |
Posted By: TheFerret
Date Posted: 12 Jan 2008 at 2:39pm
|
Hi, Brentjedi, Had a busy couple of weeks so no time to reply. Yes the 34MA compared to 34MA of 5 weeks ago is a pre made scan. It is called "JB Rising Trend". In regards to locating when the price closes above the purple entry line, I edited the JB Volatility Profit Taker Scan which as it stands by default only locates when to take profit, not when to enter.(pretty useless if you ask me, as you'd be watching your own shares closely anyway). By default it looks like this: 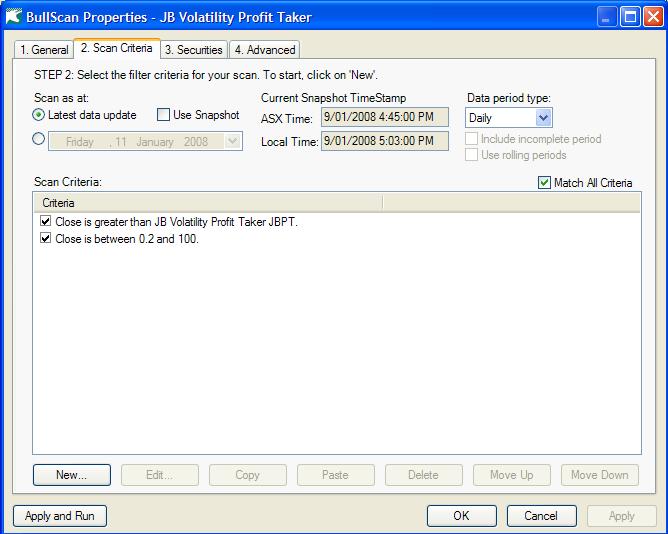 To locate the Ferret Entry points you need to change it so it looks like this: 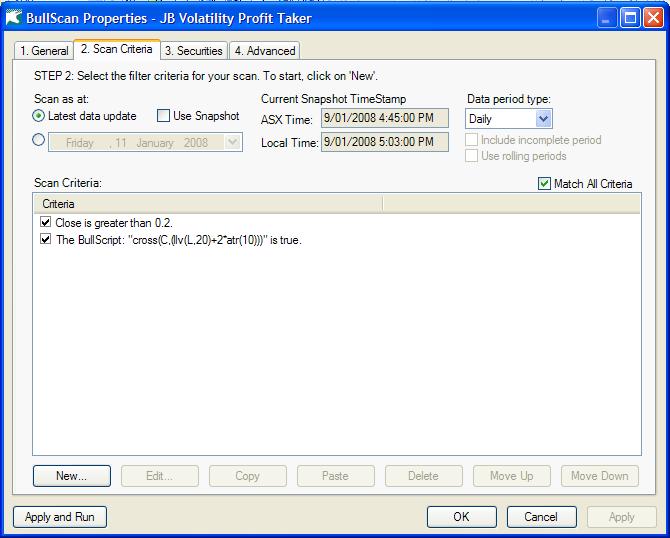 First click once on "close is > than JBVPT" line, then "DELETE" button. Then double click on "close is between 0.2 and 100" and change the comparison to "Greater than". Then OK. (this lets you pick up shares like RIO) Next click the NEW button to add the all important line. Category......"Uses Bullscript" Where it says H+L/2 replace this with cross(C,(llv(L,20)+2*atr(10))) Type of Comparison "is true" Then click OK button Your window should now look like the one above. This scan will find all of your entry ferret points. Now before you add this next bit please read the last paragraph or save what you have as this is a good scan. If you want to add the macd scan to it save what you have done and then create a copy of it and rename it as another scan name. In regards to including a search that also finds when the macd(12,26,9) crosses up, you will need to add another NEW line with the new button. Again Category "Uses Bullscript" Where it says H+L/2 CLICK the Editor button and replace H+L/2 with this: n1 := 12; n2 := 26; ns := 9; r1 := 2/(n1+1); r2 := 2/(n2+1); ma12 := C*r1 + previous(C)*(1-r1); ma26 := C*r2 + previous(C)*(1-r2); res := wait(ma12 - ma26,25); signal := ma(res,ns,E); cross(res,signal) Click OK Then type of Comparison "is TRUE" And there you have it. As to whether you will get any joy from entries using this combination of indicators, I have my doubts. As I have said before the JB entry indicator works only if an oversold signal is also present on the RSI(C,7). What I do is 1. Scan for the ferret entry 2. Scan those scan results with the JB rising scan.( you can do this by selecting securities in the JB rising scan of "Last Scan Results") 3. Scan these results with the premade JB RSI 7 scan. ( you can do this by selecting securities in the JB RSI 7 of "Last Scan Results") that should narrow things down a bit. 4.But remember the Sector should also be in a rising trend. Although You may not find much in the current market and I personally am only Short at the moment. Good Trading The Ferret. |
Posted By: brentjedi
Date Posted: 13 Jan 2008 at 2:03am
|
Ferret Brilliant pure genius.  I added that it must also be above the 200ma to the scan and it is very cool. Got two shares at the end OKN and CPS which is excellent as the market is as you said a short market. So giving only two is excellent. Sir Ferret, Could you please show a screen shot of the actvest/guppy mma setup?. I know of some people using a 15 day breakout or stat crossover to a new low or something along those lines. The Ferret Short code for some unknown reason is not working at the moment BC says its doesn't contain any BC code?. Anyway the market is really sick with little volume. But its not over until the fat lady sings!!!!!!.  Cheers Brentjedi ------------- Trading is art of self |
Posted By: TheFerret
Date Posted: 13 Jan 2008 at 4:28pm
|
Dear Brentjedi, After writing that post I realised that there is an easier way to do it than what I did.When you add a new line to your scan choose a category of "Is an indicator signal" and then search in the list below for your indicator, In my case it is called "Mitchs JB volatility Entry Only". The parameter button lets you choose the flag(start ,stop, above ,below...) Set Type of comparison is true. You can do the same for the macd. Anyway what I sent you still works even if it is more complicated. In regards to the Actvest Guppy setup, first let me say that I am an Actvest subscriber. The main reason for this is because the newsletter gives me a weekly list of Fundamentally Sound and Fundamentally Unsound Equities which have been generated by StockDocter and I use these as a basis for scans for Long and Short Trades respectively. This is a lot cheaper than subscribing to Stock Doctor. Anyway I have found that using the JB short scan although I use it does not pick up some opportunities that an Actvest Gmma Graph shows me. Example 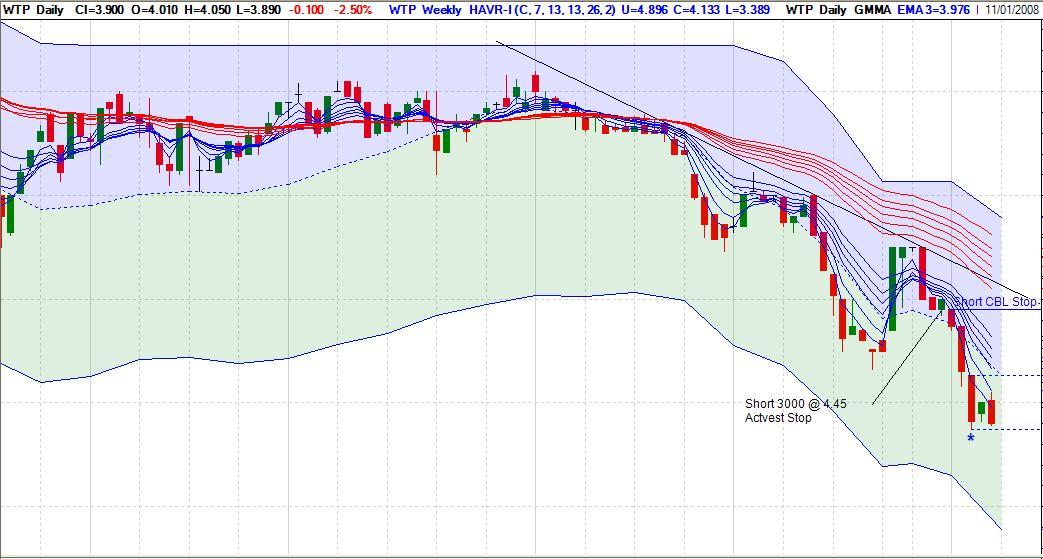 You have to search for the "Hull Actvest Range - Indicator" and "Hull Actvest ROAD" to create a Shorting Actvest Template like this then add the Guppy GMMA over the top of it. Here WTP is on the Actvest list and the Short Term Gmma have retraced back to the LTGMMA rolled back down, and then started to spread.While the price is still in the Actvest Short Zone. The chart without the GMMA does not seem as revealing to me. 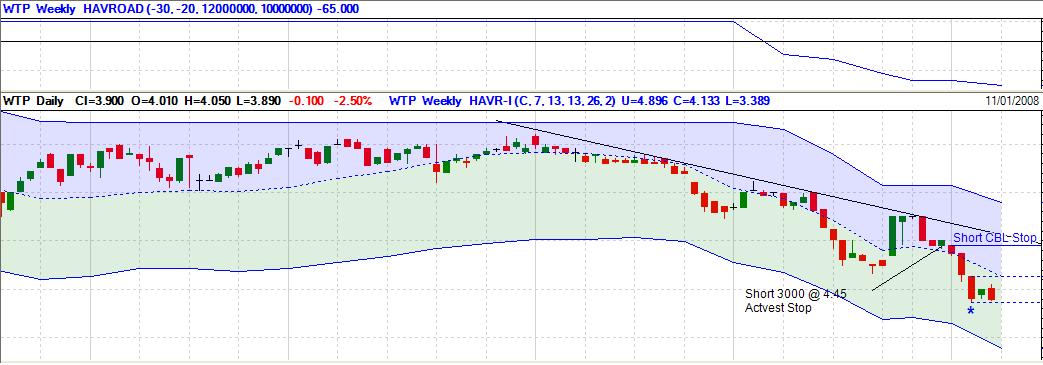 Guppys Trend Trading Book is a good place to start for GMMA analysis as is his weekly newsletter. I also look at Hull Actvest Range + Indicator with the GMMA overlaid for my longs. The JBshort code should be working maybe you have accidently overwritten something. Try recoding it again. Also I don't use that JBRSI 7 scan as I said in the last post because when you are searching for a JB Long and you get a Start signal, At that time the RSI usually is not oversold but it is important that it has recently been oversold. So what I actually do is use steps 1 and 2 as I stated and then visually scan these results looking for a recently over sold condition. Regards TheFerret |
Posted By: maximo
Date Posted: 14 Jan 2008 at 10:59pm
|
Hi All, Great to see some active scripters and traders on here :) It's taken me a while to script this due to the way the lines move and dual colouring, but it may be of use to those who use ATR and also trade on the short side. My indicator is good for that and as a trend indicator and stoploss. ATR level is calculted from the median price and has volatility factored in. So have fun with it and let me know what you think. Perhaps they can add it in the next version of BC. Cheers! { Stop Loss & Trend } [Target =Price; LineStyle=Solid; Author=Michael, Max]TDate:= InputDate("Date of trend", date(2007,06,04));HoldingDays:= BarsSince(OnOrSkipped(TDate));V1:= Input("ATR Range",2.5,1);V2:= Input("ATR Periods",4,3);AP:= H/2+prev(O,1)/2;Long:=AP-V1*ATR(V2)* ma(open/hist(open,4),2,W);Short:=AP+V1*ATR(V2)* ma(open/hist(open,4),2,W);LStop := If(Long>PREV and HoldingDays,Long,If(Long<=PREV and HoldingDays,HHV(Long,15),Long));SStop := If(Short<PREV and HoldingDays,Short,If(Short>=PREV and HoldingDays,LLV(Short,15),Short));up:= if(Close<LStop and hist(Close,1) > hist(LStop,1),1,0);down:= if(Close>SStop and hist(Close,1) < hist(SStop,1),1,0);Dtrend:= if(up,1,if(down,0,prev));Utrend:= if(down,1,if(up,0,prev));LongStop := if(Dtrend and HoldingDays,Long,If(Long>PREV and HoldingDays,Long,If(Long<=PREV and HoldingDays,HHV(Long,15),Long)));Shortstop := if(Utrend and HoldingDays,Short,If(Short<PREV and HoldingDays,Short,If(Short>=PREV and HoldingDays,LLV(Short,15),Short)));[drawundefined =gap]init:= if(Dtrend=0 and Utrend=0 and HoldingDays,1,0);[Color =lime green]if (Utrend and HoldingDays and hist(Dtrend,1)=1,LongStop,if(Dtrend and HoldingDays,ShortStop,undefined));[Color =red]if (Dtrend and HoldingDays,ShortStop,if(hist(Dtrend,1)=0 and HoldingDays,LongStop,undefined));[Color =lime green]if (Utrend and HoldingDays or init,LongStop,undefined);
|

Posted By: brentjedi
Date Posted: 16 Jan 2008 at 10:59pm
|
Maximo thanks for sharing, can you run us through the buy and sell signals, or is it just sell under green line and buy over red? will try it and see how it goes Question - too you and Sir ferret, do you use Tradesim? Cheers Brentjedi ------------- Trading is art of self |
Posted By: maximo
Date Posted: 17 Jan 2008 at 11:36pm
|
brentjedi I use WealthLab and have only done a small amount of backtesting. Results of The indicator serves best as a confirmation of another entry signal like an If you would like to backtest it based on it's signals with or without other p.s. I have created a couple of other indicators that would be great for Best regards, Max |
Posted By: Trigger
Date Posted: 16 Mar 2008 at 1:40am
|
maximo, Great indicator - it does work magnificently for trending stocks (blown my mind somewhat - didn't know Bullscript allowed an indicator to change colour. I've tweaked it a little to include the close rather than the open and gone with a 10 X 2 ATR. I'm endeavouring to backtest the indicator on TradeSim with say a CCI (21) on daily. Still learning so bear with me. Interested to hear your ADX & Williams% Oscillator/High Low Channel - Donchian Channel indicator. Cheers, Trigger |
Posted By: maximo
Date Posted: 28 Mar 2008 at 3:51am
|
Thanks Trigger, Changing the colour of an indicator on price was a technical issue that needed to be solved. Thanks to BlackDog for his help with that: http://www.bullcharts.com.au/forum/forum_posts.asp?TID=295&KW=skin+a+cat&TPN=2 - http://www.bullcharts.com.au/forum/forum_posts.asp?TID=295&a mp;KW=skin+a+cat&TPN=2 I have updated that indicator now to be as accurate to the SuperTrend indicator as created by Oliver Siban. A study found in ProRealTime which is also employed by CMC Markets software. { TrendStop } [Target =Price; LineStyle=Solid; Author=Michael, Max]TDate:= InputDate("Start Date", date(2004,12,01));HoldingDays:= BarsSince(OnOrSkipped(TDate));A:= Input("ATR Multiplier",2,1);Nb:= Input("Nb Periods",5,3);Vatr:= ma((HHV(H,nb)-LLV(L,Nb))*0.38,Nb,E);Short:= ma((H+L)*0.5,Nb,E) + A * Vatr;Long:= ma((H+L)*0.5,Nb,E) - A * Vatr;LStop := If(Long>PREV and HoldingDays,Long,If(Long<=PREV and HoldingDays,HHV(Long,10),Long));SStop := If(Short<PREV and HoldingDays,Short,If(Short>=PREV and HoldingDays,LLV(Short,10),Short));up:= if(Close<LStop and hist(Close,1) > hist(LStop,1),1,0);down:= if(Close>SStop and hist(Close,1) < hist(SStop,1),1,0);Dtrend:= if(up,1,if(down,0,prev));Utrend:= if(down,1,if(up,0,prev));LongStop := if(Dtrend and HoldingDays,Long,If(Long>PREV and HoldingDays,Long,If(Long<=PREV and HoldingDays,if(Barssince(Dtrend)<=10,HHV(Long,8),HHV(Long,15)),Long)));Shortstop := if(Utrend and HoldingDays,Short,If(Short<PREV and HoldingDays,Short,If(Short>=PREV and HoldingDays,if(Barssince(Utrend)<=10,LLV(Short,8),LLV(Short,15)),Short)));[drawundefined =gap]init:= if(Dtrend=0 and Utrend=0 and HoldingDays,1,0);[Color =lime green]if (Utrend and HoldingDays and hist(Dtrend,1)=1,LongStop,if(Dtrend and HoldingDays,ShortStop,undefined));[Color =red]if (Dtrend and HoldingDays,ShortStop,if(hist(Dtrend,1)=0 and HoldingDays,LongStop,undefined));[Color =lime green]if (Utrend and HoldingDays or init,LongStop,undefined);
|
Posted By: maximo
Date Posted: 28 Mar 2008 at 4:12am
|
I have completed the Williams Oscillator + HiLo (dochian chan) filtered Indicator. Both these indicators work well together. Named this one TrendBars, the one above named as TrendStop. They should then appear alphabetically next to each other in list. The strategy employs the sharpest trend detection possible, so I recommend adjusting the HiLo filter period to 6 or 8 to make it less sensative to trend changes. I will post a picture to show the way I set up this combination. Even though i favour candlesticks it's better to have it set on bars, that way you can tell if the close was higher or lower, since the bars are coloured according to trend instead of Open to Close. { Trend Bars } [Description:="Williams Oscillator + HiLo Filtering"] [Target =Price; Author=Michael, Max]n := input("Williams% Period",14,1);x := input("HiLo Filter Period",3,2); {3,6,9 higher=less trades}WO := -100 * ( highest(H,n) - C) / (highest(H,n) - lowest(L,n)) + 100;LL:= If (LLV(L,x)<hist(LLV(L,x),1),1,0);HH:= If (HHV(H,x)>hist(HHV(H,x),1),1,0);SigLL:= if(LL,1,if(HH,0,prev));SigHH:= if(HH,1,if(LL,0,prev));SignalShort := If(WO < 66 and hist(WO,1) > 66 or hist(WO,1) > 33 and WO < 33,1,0);SignalLong := If(WO > 33 and hist(WO,1) < 33 or hist(WO,1) < 66 and WO > 66,1,0);SigLong := if(SignalLong,1,if(SignalShort,0,prev));SigShort := if(SignalShort,1,if(SignalLong,0,prev));SL:= If(SigLong and SigHH,1,0);SS:= If(SigShort and SigLL,1,0);[linestyle =pricecolor][color =rgb(98,217,98)] {lime green}SLb:= If(SL,1,if(SL=0 and SS=0,prev,0));SLb; [color =rgb(226,118,118)] {red}SSb:= If(SS,1,if(SS=0 and SL=0,prev,0));SSb; {Profit Take} PTflag:= input("Profit Take (1=On, 0=Off)",1,0,1);PTL:= if(C-LLV(L,13) > 6*hist(ATR(4),13),1,0);PTS:= if(HHV(H,13)-C > 6*hist(ATR(4),13),1,0);[linestyle =marker; marker=type2; name=P]if (PTflag and PTL and hist(PTL,1)=0 and SL,1,0);[linestyle =marker; marker=type1; name=P]if (PTflag and PTS and hist(PTS,1)=0 and SS,1,0);{Stops and Target} [drawundefined =gap][linestyle =dotted; color=blue]{HighestHigh3 & LowestLow3 weighted ATR stop} AP:= H/2+prev(O,1)/2;[color =rgb(98,217,98)] {lime green}hiband:= ma((AP-1.33*ATR(4) + LLV(L,x)*2)/3,2,S);if (SLb,HHV(hiband,3),undefined);[color =rgb(226,118,118)] {red}loband:= ma((AP+1.33*ATR(4) + HHV(H,x)*2)/3,2,S);if (SSb,LLV(loband,3),undefined);{Entry Bar Stop} [linestyle =points; color=red]if (SLb and Hist(SSb,1),L-(L/100)*0.15,undefined);if (SSb and Hist(SLb,1),H+(H/100)*0.15,undefined);[linestyle =points; color=cyan]{save limit entry prices} LE:= if(SLb and Hist(SSb,1),C,0);SE:= if(SSb and Hist(SLb,1),C,0);if (LE,LE+1*hist(ATR(6),1),undefined);if (SE,SE-1*hist(ATR(6),1),undefined);
|
Posted By: maximo
Date Posted: 28 Mar 2008 at 4:30am
|
I have yet to do work on the ADX system, but here's the above indicator combination displayed.
|

Posted By: brentjedi
Date Posted: 31 Mar 2008 at 12:00am
|
Hi MAXIMO I must say you and black dog are geniuses with BS. How did you do it?, are you programmers ?. Their seems to be a big hole for BS know how. In any case I would like to ask you if you could help me with this problem. I am using a ROC indicator greater than value, if true then it flags a buy setup trigger.eg ROC(C,10,%) >1 this I can do easy. However I want to use tradeslim or scan where the above is true and price has closed above the bar that triggered the ROC. any suggestions? I have the ROC as a 1,0 in a seperate panel at the bottom. Cheers Brentjedi ------------- Trading is art of self |
Posted By: maximo
Date Posted: 31 Mar 2008 at 4:11pm
|
LoL! I do have a programming background in assembler, that doesn't really help. Bullscript is quick to tell you you've made a mistake, so more than anything it's like a spoken language. You learn 1 word at a time and just build on that. Look at other indicators etc. Don't think i can help you with Tradesim as i don't have it. Can do a scan for them though. I made an indicator firstly. Then made a new scan name ROC 10. The scan criteria = Category: [Indicator is a signal] select: Rate Of Change (which is the following formula name). Interestingly it doesn't bring them all up like VPG should have been found.. but it wasn't. So hope that helps.
n := input("Enter the ROC length", 14, 7, 52);x := roc(C,n,PERCENT);x; [linestyle =marker; marker=type2; name=x]if (hist(x<10,1) AND x>10,1,0);
|
Posted By: brentjedi
Date Posted: 05 Apr 2008 at 10:50pm
|
Hi MAXIMO Thank you, I can now get the makers up saying buy or sell when the formula = true. However I was hoping for a line above or below the trigger bar that stretched say three bars. As I use the formula = true to highlight the bar and if the high or low is broken by the next bar, I would go long or short. thanks again Cheers Brentjedi ------------- Trading is art of self |
Posted By: maximo
Date Posted: 10 Apr 2008 at 12:18am
|
Hiya Brentjedi I modified it a bit to show the direction of the following bar using a marker, though you may want to apply it to the chart and change it to a line. Looks like the Barssince Function will do the job of pinpointing how ever many bars after the signal you want to indicate with a line or marker. Many good signals from it and I hope your backtesting is going well. n := input("Enter the ROC length", 14, 7, 52);method := inputroc("Enter the ROC method",PERCENT);x := roc(C,n,PERCENT);x; [linestyle =marker; marker=type2; name=x]condition:= if(hist(x<10,1) AND x>10,1,0);condition; [linestyle =marker; marker=long; name=""]if (hist(barssince(condition),0)=true and H>hist(H,1),1,0);[linestyle =marker; marker=short; name=""]if (hist(barssince(condition),0)=true and L<hist(L,1),1,0);
|
Posted By: loop4ever
Date Posted: 13 Jun 2008 at 9:46pm
|
Maximo, is the TrendStop code you posted give the exact same signal as the CMC MarketMaker SuperTrend indicator?
|
Posted By: maximo
Date Posted: 14 Jun 2008 at 4:08pm
|
No the signals are not the same. SuperTrend allows for 3 different kinds of averages to be used SMA,WMA,EMA and 3 different base levels Close, Weighted Close, Median price and also an average of all 3 together. Which one CMC chose to use is anyones guess.. and they wont give me the code! |
Posted By: jhubbard
Date Posted: 07 Feb 2011 at 11:10am
|
Hi Maximo, Thanks for these indicators, they are great. In fact, they seem almost too good to be true! Are you sure that they don't "repaint" at all? Cheers, Jeremy. |
Posted By: maximo
Date Posted: 07 Feb 2011 at 11:16pm
|
G'day Jeremy,
I've updated the code, more accurate and simplified, no repaint.
[Description ="SuperTrend - Max"][target =price]Mult:= Input("ATR Multiplier",3,1);Nb:= Input("Nb Periods",8,1);method:= inputma("Method",Wilders);price:= Input("1=Median, 2=Close",1,1);TruRan:= ma(ATR(1),Nb,method)*Mult;HiLimit:= if(price=1,(H+L)/2-TruRan,C-TruRan);LoLimit:= if(price=1,(H+L)/2+TruRan,C+TruRan);LB:= If(HiLimit>=PREV and HiLimit<C,HiLimit,If(C<PREV,HiLimit-0.1,PREV));UB:= If(LoLimit<PREV and LoLimit>C,LoLimit,If(C>PREV,LoLimit+0.1,PREV));Trend:= if(UB>ref(UB,-1),1,if(LB<ref(LB,-1),-1,prev));[drawundefined =gap][Color =lime green]if (Trend=1 and hist(Trend,1)=-1,LB,if(Trend=-1,UB,undefined));[Color =red]if (Trend=-1 ,UB,if(hist(Trend,1)=1 ,LB,undefined));[Color =lime green]if (Trend=1 or Trend=0,LB,undefined);{ Paint bars} Flag:= input("PaintBars On=1, Off=0",0,0,1);[linestyle =pricecolor; color=rgb(98,217,98)]If (Trend=1 and Flag=1,1,if(Flag=0 and C>O,1,undefined));[color =rgb(226,118,118)] {red}If (Trend=-1 and Flag=1,1,if(Flag=0 and C<=O,1,undefined)); |
Posted By: jhubbard
Date Posted: 09 Feb 2011 at 1:10pm
|
Thanks Maximo, much appreciated. I'm doing some backtesting at the moment - will let you know if I find anything worth while! Cheers, Jeremy. |
Posted By: stevo
Date Posted: 10 Oct 2021 at 12:54am
|
Hi Ferret, Hope your still here as the post I’m referring to is 14
years old. The JB Entry indicator / Ferret Indicator is terrific. Is it possible to add a line of code so that it only shows
on the chart for 20 bars after the RSI has been lower than 30? Just trying to clean up the chart by removing the line where
it’s not wanted. If Ferrets not around I hope someone else could help. Cheers Ian |
Posted By: Pokitren
Date Posted: 02 Feb 2022 at 7:43pm
Yeah) Hardly anyone will answer after 14 years. I'm interested in the question, too, though.
|
Posted By: rbbrain
Date Posted: 25 Aug 2022 at 5:13pm
|
Hi Maximo, Our BullCharts User Group is using a "private" Google Drive to store user group presentations and Custom Indicators and scans. I am hoping that you are happy for me to include your SuperTrend code in the Google Drive for other users to find easily? Cheers Robert B ------------- Convenor - Australian BullCharts User Group http://www.RobertBrain.com - Brainy's Share Market Toolbox and BullCharts Tips [/CENTER |
Posted By: maximo
Date Posted: 27 Aug 2022 at 3:32pm
|
Yes, that's fine Robert. |