Intraday trading Support and resistance and trend |
Post Reply 
|
Page <123 |
| Author |
 Printable Version Printable Version Delicious Delicious Digg Digg Facebook Facebook Furl Furl Google Boomarks Google Boomarks Google Buzz Google Buzz MySpace MySpace Newsvine Newsvine reddit reddit StumbleUpon Translate StumbleUpon Translate Twitter Twitter Windows Live Windows Live Yahoo Bookmarks Yahoo Bookmarks Topic Search Topic Search  Topic Options Topic Options
|
cmacdon 
BullCharts Guru 
Joined: 09 Sep 2012 Location: Brisbane Posts: 236 |
 Post Options Post Options
 Quote Reply Quote Reply
 Posted: 28 Dec 2012 at 2:48pm Posted: 28 Dec 2012 at 2:48pm |
|
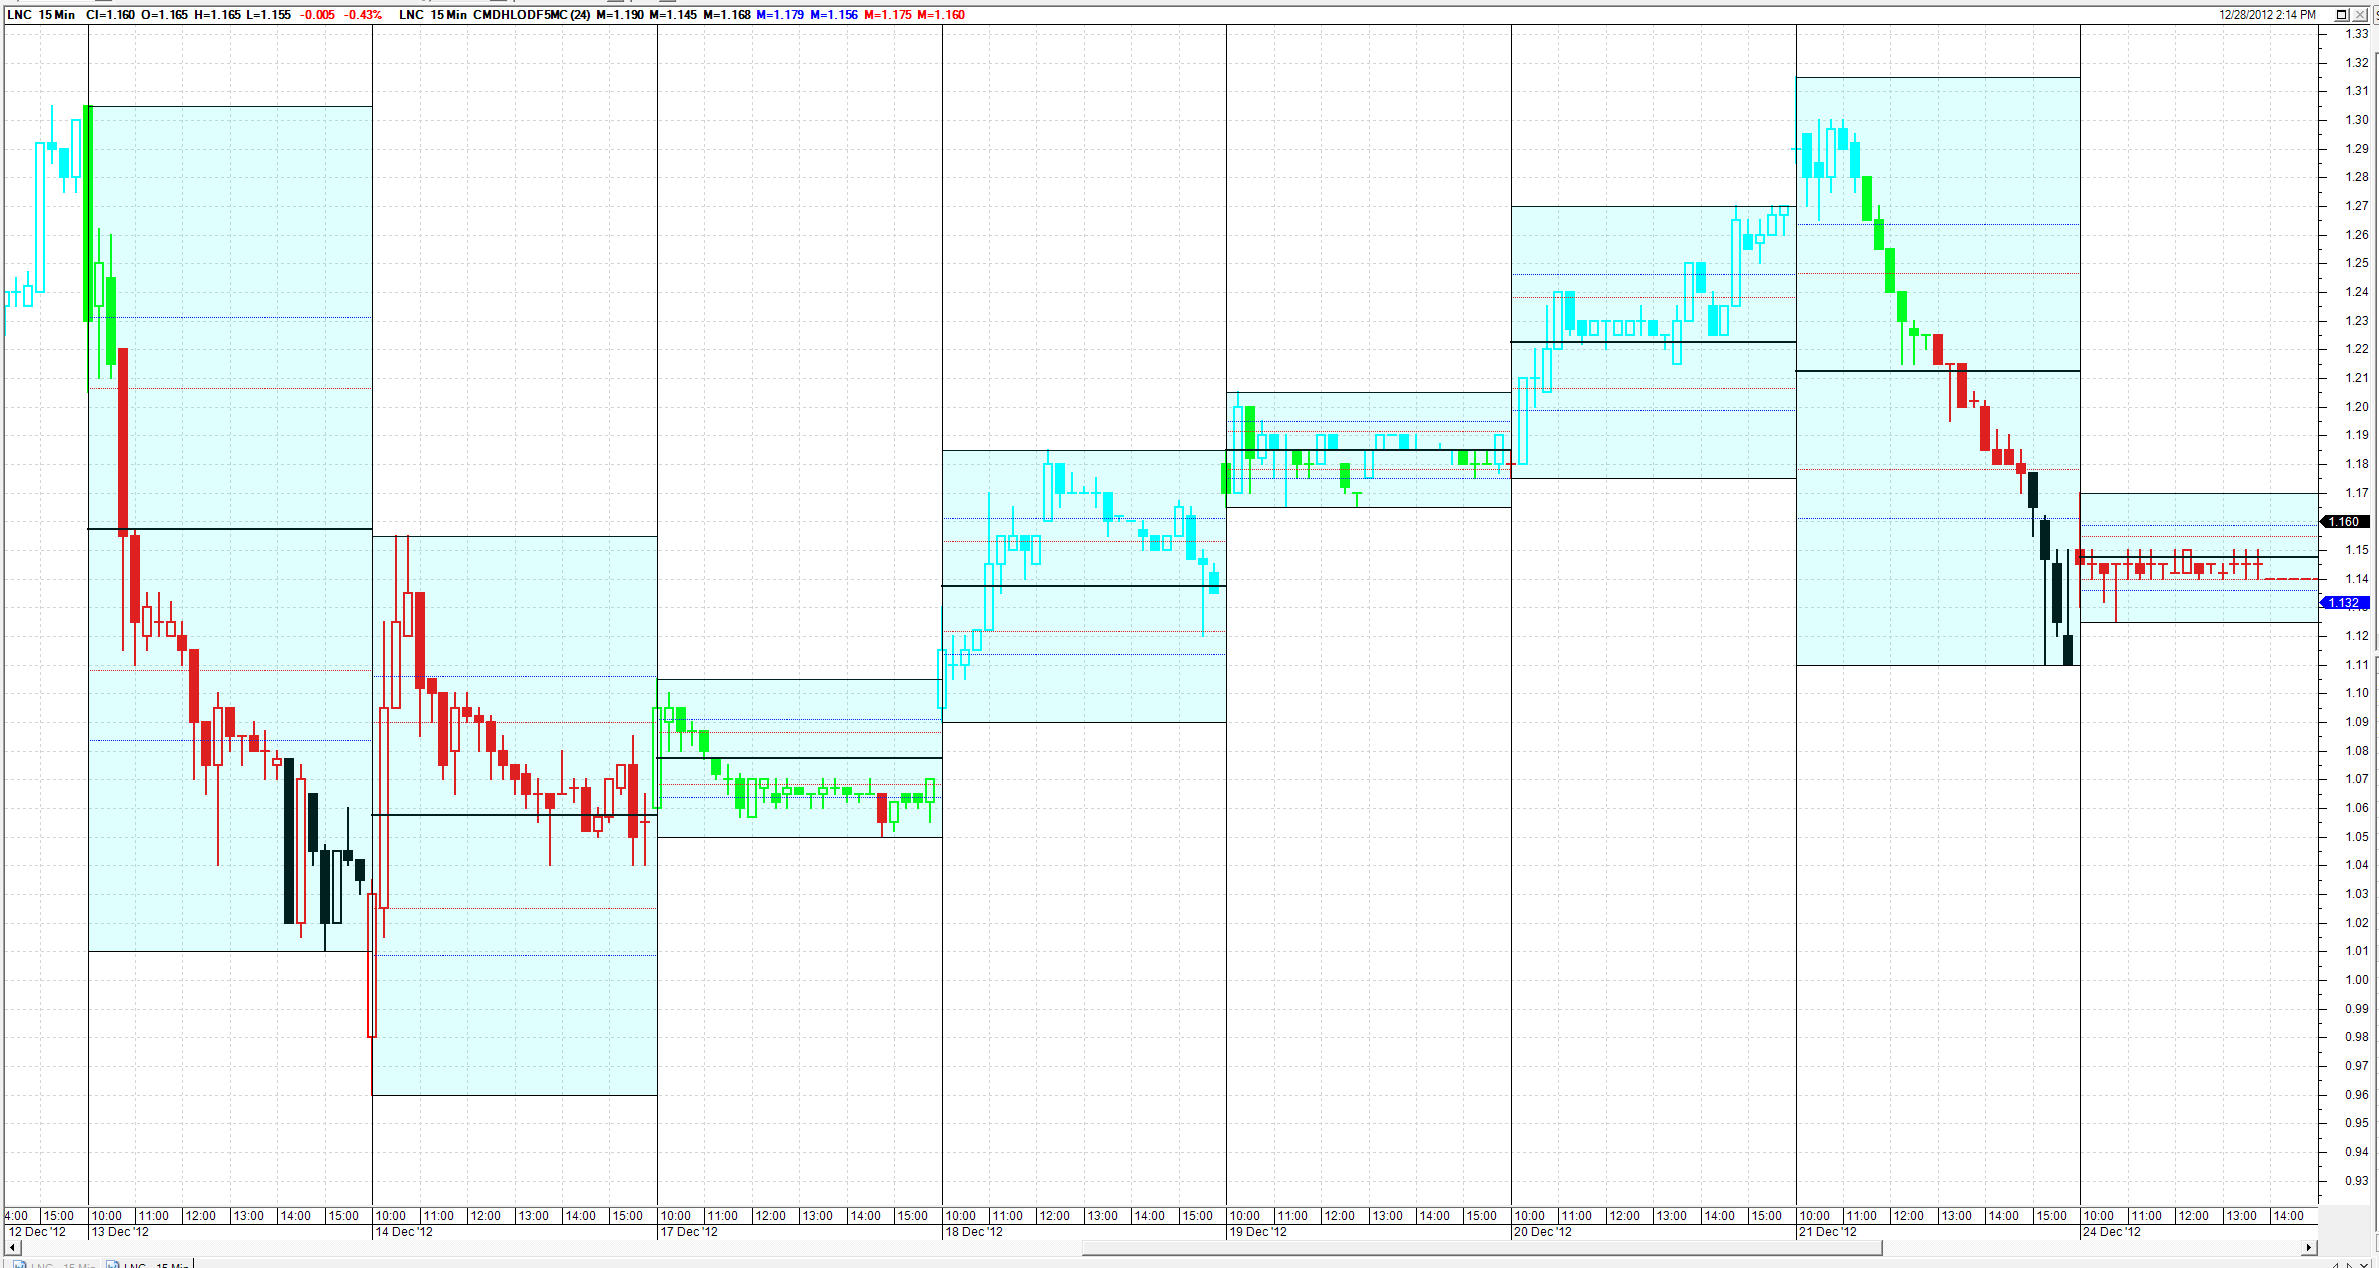
Various writers Linda Bradford Rashke, Al Brooks , Mark B. Fisher when discussing
intraday trading suggests that the High or Low of the previous Day are
important support and resistance levels for the next days trading decisions. Here are a couple of indicators that show the previous day’s
High and Low levels. The Highs or lows are drawn horizontally 1 bar at a time
whilst each of the following day’s similar
time periods elapses. Depending on the intraday time frame adopted ,the setting of
the indicator should be changed e.g. there are 24 X 15 minute periods in 6
hours of ASX trading so if you use a 15 minute chart the setting is 24. A 5 minute chart has a setting of 72 etc. The settings identify the bars in the
previous day for the indicator to do its thing measuring the highest high or low over that indicator period. You can also go into Advance tab and do a Horizontal shift
of -24 or -72 and the high and low will
be shifted to the day before. Once set
up I save as templates for 5 min, 15 min and hourly charts. I put on some Gann levels for: 25%, 50% 75%, 33% and 66% between the Highs and lows for
interest so you can see if current price is starting to get relatively stronger
of weaker. The bars have been color coded for position of the close of a
new bar relative to yesterday’s support and resistance or for breaking outside
yesterday’s high or low. (Cyan if close
is above yesterdays high, Lime if close is above the 50% level of yesterday and
below yesterday’s high. Red if below the
50% level and above yesterday’s low and black if the bar is below yesterday’s
low). The second indicator is similar but the comparative High and
Low resistance is for the previous hour rather than yesterday. (The indicator is not so good if there are public holiday
intraday time periods so charts below show more normalized trading periods). Also below is a code for similar logic but a new bar is coloured relative the high or low of the previous hour's high or low.
|
|
|
BC User since June 2007
|
|
 |
|
|
Post Reply
|
Page <123 |
| Forum Jump | Forum Permissions You cannot post new topics in this forum You cannot reply to topics in this forum You cannot delete your posts in this forum You cannot edit your posts in this forum You cannot create polls in this forum You cannot vote in polls in this forum |