MACDH and Force Index peaks
Printed From: BullCharts Forum
Category: BullCharts
Forum Name: BullScan
Forum Discription: For discusssions on BullScan
URL: http://www.bullcharts.com.au/forum/forum_posts.asp?TID=997
Printed Date: 30 Apr 2024 at 8:41pm
Software Version: Web Wiz Forums 9.69 - http://www.webwizforums.com
Topic: MACDH and Force Index peaks
Posted By: Bana
Subject: MACDH and Force Index peaks
Date Posted: 20 Nov 2015 at 2:54pm
|
Hi All I would love some help with building a scan. This is related to Dr Alexander Elder's trading strategies. SCAN 1 I want to find stocks whose MACDH within the last 30 days has been the highest it has been over the past one year from the date of scan. This is to keep and eye on potential bearish development. Vice-versa scan to find stocks whose MACDH within the last 30 days has been the lowest it has been over the past one year from the date of scan. This is to keep an eye on potential bullish developments. I have been able to partially create scan which only check the latest bar for being the highest/lowest it has been over the past one year. However, I want to scan for this criteria being satisfied in any of the last 30 bars. I used 240 bars as approximation of a one-year period. SCAN 2 Pretty much same thing as scan 1 but for force index. An extreme force index indicates exhaustion of selling or buying power. In this case the periods are Fi in last 10 days highest it has been over 180 days. It would be good if the numbers can be built in as variable so that different time periods can be tested. thank you all and best of luck with your trading. Bana 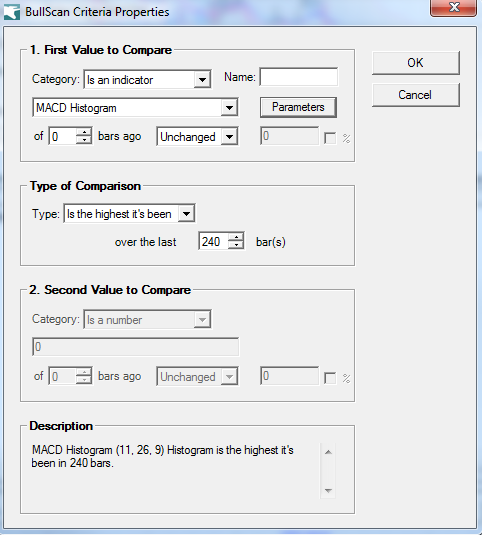 |