NEW VERSION - Calling for input...
Printed From: BullCharts Forum
Category: BullCharts
Forum Name: BullCharts discussion
Forum Discription: General discussion about getting started with BullCharts and exploring its features.
URL: http://www.bullcharts.com.au/forum/forum_posts.asp?TID=928
Printed Date: 30 Apr 2024 at 11:41am
Software Version: Web Wiz Forums 9.69 - http://www.webwizforums.com
Topic: NEW VERSION - Calling for input...
Posted By: rbbrain
Subject: NEW VERSION - Calling for input...
Date Posted: 16 Aug 2013 at 9:46am
|
The BullCharts development team are now compiling a list of desired / new features, tweaks, etc., and are calling for input from the user community. So, if you have any suggestions or ideas for new or enhanced features, please submit via this forum, and I will be consolidating the list and passing on to the team. (This same message was posted in the Yahoo Forum - no need to duplicate the feedback). If there are too many suggestions, we might need to prioritise them based on popularity. Looking forward to your feedback. Cheers Robert B ------------- Convenor - Australian BullCharts User Group http://www.RobertBrain.com - Brainy's Share Market Toolbox and BullCharts Tips [/CENTER |
Replies:
Posted By: joea
Date Posted: 17 Aug 2013 at 7:55am
|
Robert in relation to updating data. Currently what exist is updating all the data each hour. How about having the data updating on the stocks that you look at with a 20 minute delay. This keeps the cost of data down. I have not observed intra day data, but it could have the same concept. This solves two problems. 1 The data is up to date quickly on which stocks you look at. 2 Its not updating the complete data. 3 Any chats open are updated each 20 minutes. End of day update will update the complete data base. cheers |
Posted By: rbbrain
Date Posted: 17 Aug 2013 at 10:55am
|
Thanks Joe, A reasonable request - I can add to the list. Cheers Robert B ------------- Convenor - Australian BullCharts User Group http://www.RobertBrain.com - Brainy's Share Market Toolbox and BullCharts Tips [/CENTER |
Posted By: joea
Date Posted: 18 Aug 2013 at 10:30am
|
Robert When you complete a scan. You receive a list of stocks if you get any hits. You then click on the first stock and a chart template pops up showing the scan date by a vertical red dotted line. That's fine. How ever if you then click to one of your own templates with your desired indicators, the scan date disappears. How come. You are still looking at the list of stocks by the scan. Can the scan date be applied to all chart templates.? |
Posted By: rbbrain
Date Posted: 20 Aug 2013 at 4:33pm
|
Hi Joe and everyone. We have received quite a few suggestions in this forum, and the Yahoo forum, and by email. I am currently working through them and putting into an overall document, and happy to share (in a few days time... currently busy preparing for the ATAA booth at the Melbourne Trading Investing Expo later this week). I will post a further update in a few days time. In the meanime, please keep the suggestions coming - all good. Regards Robert B ------------- Convenor - Australian BullCharts User Group http://www.RobertBrain.com - Brainy's Share Market Toolbox and BullCharts Tips [/CENTER |
Posted By: reasons
Date Posted: 24 Aug 2013 at 12:24pm
|
I would love to see the crosshair cursor showing the relevant timeframe on multiple floating windows. In other words, if I have 3 computer screens with daily, weekly and monthly charts floated on the separate screens, and I place the cursor on the weekly history on one screen, it will also display the crosshair cursor where I am looking on weekly, in the relevant timeframe on the daily and monthly screens. The cross hair centre would be positioned proportionately in regards to BOTH the X and Y axis on the other 2 screens. Thanks for your consideration. |
Posted By: RainMakerFaker
Date Posted: 02 Jan 2014 at 1:24pm
|
I would like the option of having the volume bars in the background of the main candlestick chart. It would save space when other indicators are loaded in a pane.
Thank you for considering the request!
|
Posted By: rbbrain
Date Posted: 03 Jan 2014 at 10:34am
|
Hi RainMakerFaker, Good question. There is a way to do it already... BC sees the Volume like it sees the variety of chart indicators (even though technically it's not an indicator, as it is a parameter of price). The volume can be "inserted" onto the "Price Pane" of the chart as follows:
There are some adjustments to fine tune the appearance, but it might not be possible to adjust the volume to put a lot of blank space between the price plot and the volume bars. Cheers Robert B ------------- Convenor - Australian BullCharts User Group http://www.RobertBrain.com - Brainy's Share Market Toolbox and BullCharts Tips [/CENTER |
Posted By: RainMakerFaker
Date Posted: 03 Jan 2014 at 8:48pm
|
Thank you Robert it works a treat.
------------- |
Posted By: mcdirt
Date Posted: 25 Jan 2014 at 3:53pm
|
A bit late to the party, but things I'd find nice/useful would be ... 1) BullScript - Find & Replace in BullScript edit boxes. 2) BullScript - expanding marker= to allow more symbols to be put onto charts and to be able to specify the colour, size & position of symbols in the code (can't find out how to do this) rather than manually doing it through the Styles tab. 3) BullScript - the ability to put Text Strings anywhere on the screen, to allow it to be placed on any Pane & anchored to any of the 4 corners with an X + Y Offset & to be independent of the Price Plot (ie to stay on screen as the chart scrolls). Size/colour/font set with BullScript functions. I'd like to be able to put chart & Indicator data onto the right margin or other areas as info. 4) Add O[1] as shorthand equivalent to Ref(O,-1) or Hist(O,1) which become bulky in long statements. Most of my BullScripts have to start with multiple lines like O1:=Hist(O,1) etc etc etc for every bar I wish to reference. 5) Undo function. 6) Synchronised vertical lines option in linked charts. 7) I'd like the Window Tiling function to make equal square/rectangular charts when activated with 4 charts open, not the 2 vertical & 2 horizontal it does in current version. I'd also like Chart Bars to draw properly spaced. The spacing between each bar often is not equal with some bars touching whilst others have extra wide gaps. This is especially noticeable on Volume plots. Thanks for considering any of these.
|
Posted By: rbbrain
Date Posted: 26 Jan 2014 at 9:22am
|
Hi mcdirt, Thank you for your input- we can add these items to our wish list for future upgrades. re: Chart bars spacing.... not sure exactly what you are referring to - can you post a chart picture? Cheers Robert B ------------- Convenor - Australian BullCharts User Group http://www.RobertBrain.com - Brainy's Share Market Toolbox and BullCharts Tips [/CENTER |
Posted By: mcdirt
Date Posted: 26 Jan 2014 at 3:04pm
|
Hi Robert, This is a Weekly chart of XJO Volume showing uneven spacing of bars - some are touching and others have big gaps - does not make BC look Professional grade charting program! 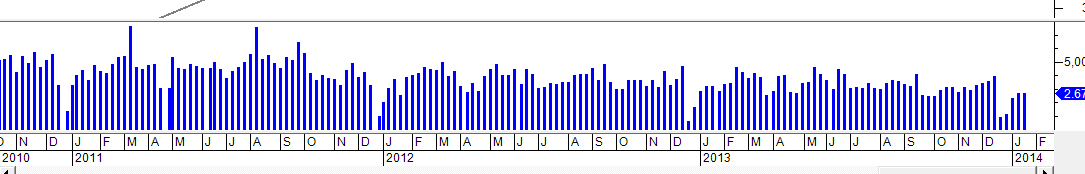 |
Posted By: mcdirt
Date Posted: 30 Jan 2014 at 12:46am
|
I'd also like to have the Tile Windows function work so that the placement of the windows can be changed by re-arranging the tabs at the bottom of the screen. If I rearrange the tabs, then select Tile Windows, I'd like the Windows to redraw so that I can get each window I want in my preferred position. I cannot figure out how to do this in the current version, the Windows always draw in some arbitrary order & I cannot change it. Hopefully I've explained what I mean. thanks mcdirt
|
Posted By: rbbrain
Date Posted: 30 Jan 2014 at 10:22am
|
Hi mcdirt, Sorry for delay in replying. This is regarding the "feature" that you highlight to do with the volume axis and scale. I can see the issue that you refer to; however, I think this is how it is supposed to be. Any "gaps" that you can see are due to non-trading days such as holidays. Please remember that the time axis on a regular price chart is a strict linear scale, so BullCharts handles the data correctly. The gaps indicate the non trading days. If you think this is not professional, then take a look at something like http://stockcharts.com/h-sc/ui - http://stockcharts.com/h-sc/ui and view the weekly version of the chart. Notice that all volume bars touch the adjacent bars, and that some bars are thinner than others. But, do you have a price chart from another professional charting program which does not show gaps? If so, please post it for the developers to look at and comment on. Also, you are looking at a weekly chart, which complicates things a little. Because the vertical bars that are along the axis between the month letters, suggest the months are different durations. And in fact this is somewhat true. Notice that the last day of a calendar month is sometimes mid-week, so the vertical bars along the axis ought to be placed exactly where the month ends. Interpreting this on the chart is not easy. ------------- Convenor - Australian BullCharts User Group http://www.RobertBrain.com - Brainy's Share Market Toolbox and BullCharts Tips [/CENTER |
Posted By: mcdirt
Date Posted: 31 Jan 2014 at 1:19am
|
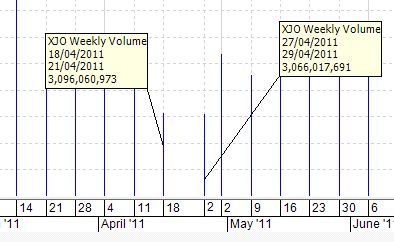
Hi Robert, Surely a weekly chart should just be a continuous series of bars/candles, one for each trading week and equally spaced, irrespective of when the 1st day of any year or the start/end of any month is? The only time you would get a zero volume bar (gap) on the chart of the XJO would be if the ASX was closed for an entire week which does not happen? rgds mcdirt |
Posted By: mcdirt
Date Posted: 31 Jan 2014 at 2:48am
Comparison of MetaStock v11 (top) vs BullCharts (bottom) ...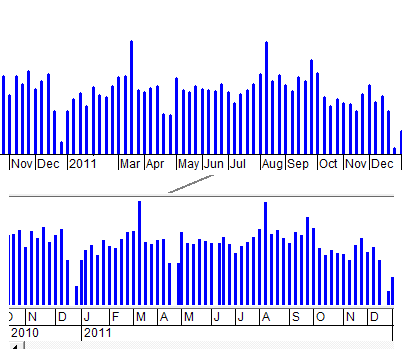 |
Posted By: rbbrain
Date Posted: 31 Jan 2014 at 5:44pm
|
Hi mcdirt, I will refer this to the developers and tech support staff for comment. Cheers ------------- Convenor - Australian BullCharts User Group http://www.RobertBrain.com - Brainy's Share Market Toolbox and BullCharts Tips [/CENTER |
Posted By: rbbrain
Date Posted: 04 Feb 2014 at 2:20pm
|
Hi mcdirt and others, The tech support staff have reviewed this detail regarding the volume bars, and have agreed that a small tweak is justified. Please note the following key points:
 ------------- Convenor - Australian BullCharts User Group http://www.RobertBrain.com - Brainy's Share Market Toolbox and BullCharts Tips [/CENTER |
Posted By: mcdirt
Date Posted: 04 Feb 2014 at 8:21pm
| Thanks for the info Robert |
Posted By: joea
Date Posted: 23 Feb 2014 at 9:55am
|
Robert B It has been in excess of 6 months since your post was initiated. Perhaps it is time that a list, or 3 lists of suggested improvements be compiled. I would suggest 3, with Low, Medium and High priority. This way the users of BullCharts can see what maybe improved. I would also suggest the lists be open to comments. i.e. items on one list maybe added to another. Regardless of what you are attempting to achieve, I think a time frame would be appreciated by the users. Regards Joe Allen |
Posted By: rbbrain
Date Posted: 24 Feb 2014 at 11:49am
|
Hi Joe and all contributors, My apologies for not posting a list of suggestions - I must do that very shortly. In the mean time I can advise that the developers were able to implement several of the 34 or so major suggestions, and I have been testing a beta version of BC with these changes in place. There have been a couple of "glitches" which we cannot allow to pass on to the user community, so these are being addressed. I understand that Brendon intends to implement the new version sometime over the next couple of months. At this stage I don't know any more than that; but we can let you know if there is news. Cheers Robert B ------------- Convenor - Australian BullCharts User Group http://www.RobertBrain.com - Brainy's Share Market Toolbox and BullCharts Tips [/CENTER |