David Weis’s Weis Wave
Printed From: BullCharts Forum
Category: BullCharts
Forum Name: BullScript
Forum Discription: Technical discussion related specifically to the BullScript programming language.
URL: http://www.bullcharts.com.au/forum/forum_posts.asp?TID=838
Printed Date: 30 Apr 2024 at 1:54pm
Software Version: Web Wiz Forums 9.69 - http://www.webwizforums.com
Topic: David Weis’s Weis Wave
Posted By: lmbull
Subject: David Weis’s Weis Wave
Date Posted: 27 Jun 2012 at 3:55pm
|
I was wondering if anyone has had a look at the Weis Wave. It looks as if the volume is added to preceeding volume if the close is up. When the close changes then the volume count restarts. 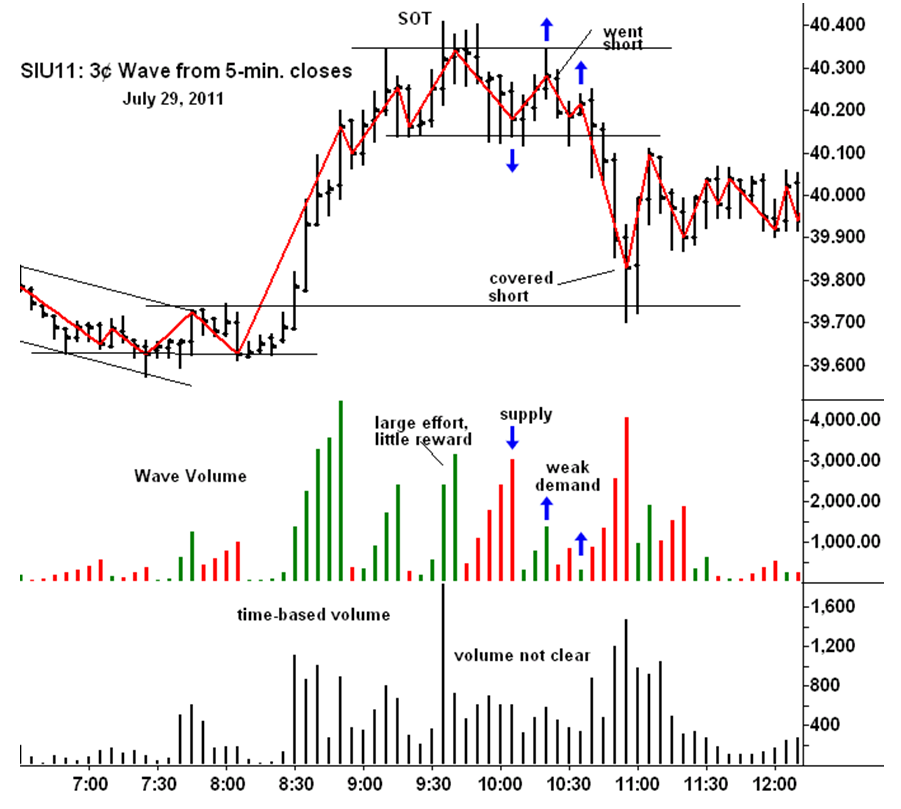 |
Replies:
Posted By: cmacdon
Date Posted: 10 Sep 2012 at 10:49am
|
Here are two separate indicators that may help. Each indicator needs to be coordinated by using the same vibration variable . The first one is the wave with a selectable vibration variable. I find most ASX stocks vibrate well at either 3,4,5 or 7. The second indicator shows in a separate panel the total volume on up and down waves similar to Weiss, and you can change tot he average volume per up and down wave similar to Tim Ord's work. {Wave Indicator} [citation ="
For Total volume interpretations refer David Weiss’s Weiss Wave,
WeissonWyckoff.com; for Average Volume interpretations refer Tim Ord, The
Secret Science of Price and Volume, Wiley Trading 2008; For earlier Swing Volume accumulation
indicator refer to Jose Silva’s Volume
- Up/Down Swing Average indicator http://trader-online.tk/MSZ/e-!-v.html
"] [target=Price] {I have found that most ASX stocks up and down
moves “vibrate” to settings of between 3 to 5, and 7} Vib:=input("Vibration", 4, .001,
100); z:=Zig(If(Outside() AND Ref(H,-1)>Ref(H,-2),H,If(Outside() AND Ref(L,-1)<Ref(L,-2),L,If((Outside() OR Inside()) AND C>O,H,If((Outside() OR Inside()) AND O>C,L,If(H>Ref(H,-1),H,If(L<Ref(L,-1),L,If(Ref(H,-1)>Ref(H,-2),H,If(Ref(L,-1)<Ref(L,-2),L,C)))))))),Vib,%); ispeak
:= z>hist(z,1) and z>future(z,1); istrough
:= z<hist(z,1) and z<future(z,1); [linestyle=Solid; color=Red] z; [color=Green] [linestyle=Text; textalign=Above,Center; color=Red] if(isPeak, " " + z, undefined); High; [linestyle=Text; textalign=Below,Center;color=Green] if(isTrough, "" + z, undefined); Low; {This section colours up wave bars green and down
wave bars red} [target=Price; linestyle=PriceColor] Trendup:=Z>ref(z,-1); Trendown:=Z<ref(z,-1); [color=Green; name=Trendup] Trendup; [color=Red; name=TrendDown] Trendown; [color=white] {Wave Total or Average Volume Indicator. Set vibration to same as used in wave
indicator} [citation ="
For Total volume interpretations refer David Weiss’s Weiss Wave,
WeissonWyckoff.com; for Average Volume interpretations refer Tim Ord, The
Secret Science of Price and Volume, Wiley Trading 2008; For earlier Swing Volume accumulation
indicator refer to Jose Silva’s Volume
- Up/Down Swing Average indicator http://trader-online.tk/MSZ/e-!-v.html
"] Vib:=input("Vibration", 4, .001,
100); z:=Zig(If(Outside() AND Ref(H,-1)>Ref(H,-2),H,If(Outside() AND Ref(L,-1)<Ref(L,-2),L,If((Outside() OR Inside()) AND C>O,H,If((Outside() OR Inside()) AND O>C,L,If(H>Ref(H,-1),H,If(L<Ref(L,-1),L,If(Ref(H,-1)>Ref(H,-2),H,If(Ref(L,-1)<Ref(L,-2),L,C)))))))),Vib,%); ispeak
:= z>hist(z,1) and z>future(z,1); istrough
:= z<hist(z,1) and z<future(z,1); UpZig:=Z>ref(z,-1); DownZig:=Z<ref(z,-1); {The next section shows the total or average volume
for each up or down waves. (The part of
the formula can be easily adapted to most other indicators by defining the
parameters for the BuyVol and downvol from any other indicator. For instance if the indicator was a
crossover of the close the set up is BuyVol =c>Ma(c,30,s) and Down
Vol<Ma(c,30,s) or see adaption to HA Volume indicator)} v1:=input("1=Total volume on wave
or 2=Average volume on wave", 2, 1, 2); [linestyle=Bar; width=4] [name=Buy Vol; color=Green] Buyvol:=
Upzig; BuyVol2:=If(BuyVol,+1*v,0); TotalBuyVol:=If( BuyVol ,+1*v+prev(BuyVol2),0); Buybars:=barssince(Buyvol2=0); if(v1=2,TotalBuyVol,undefined); if(v1=1,TotalBuyVol/buybars,undefined); [name=Sell Vol; color=Red] Sellvol:=
Downzig; SellVol2:=If(SellVol,+1*v,0); TotalSellVol:=If( SellVol ,+1*v+prev(SellVol2),0); Sellbars:=barssince(Sellvol2=0); if(v1=2,TotalSellVol,undefined); if(v1=1,TotalSellVol/Sellbars,undefined); {This section shows horizontal line for comparison purposes
from latest total or average volume calculation} [width=1] [name=Total Sell Vol; Linestyle=Dash; color=Black] if(v1=2,lastvalue( TotalSellVol),undefined); if(v1=1,lastvalue( TotalSellVol/Sellbars),undefined); [name=Total Buy Vol; Linestyle=Dash; color=Blue] if(v1=2,lastvalue( TotalBuyVol),undefined); if(v1=1,lastvalue(TotalBuyVol/Buybars),undefined); |
Posted By: lmbull
Date Posted: 10 Sep 2012 at 3:58pm
|
Fantastic work This one was definatly beyond my programing. I will have to get the book when it come out to break it all down. Once again thank you for your efforts.  |
Posted By: cmacdon
Date Posted: 10 Sep 2012 at 7:45pm
|
Imbull As the scientist say we all standing on the shoulders of the greats who went before us. I am far from any expertise in any coding but can I adapt some combination of other indicator codes if I am really interested in the particular indicator outcome for my own use. I find the easiestt sources of coding is to adapt from either Tradersonline.tk where there are some great Metastock indicator codes particulallarly by the prolific Jose Silva, and Roy Larsen that can be easily converted to Bullscript; or some of the great bullscript coding already provided on this Bullchart forum by the prolific Maximo in particular and Blackdog, My 3 posts today are purely because I was interested over recent years in VSA, Heikin Ashi and Weiss wave and decided to to put something back of the benefits I have received from these other people when a couple of posts came up recently. ------------- BC User since June 2007 |
Posted By: joea
Date Posted: 13 Sep 2012 at 4:25pm
|
For those interested in Wyckoff etc. visit http://www.readtheticker.com/Default.aspx Go to education and Indicator Library. Click RTT VolumeWave and you will see a number of dot points explaining the wave. joea |
Posted By: cmacdon
Date Posted: 17 Sep 2012 at 10:50am
|
Also a good source forunderstanding is the free nightly newsletter by David Weiss on Weissonwyckoff.com where Weiss shows how he applies Wyckoff and every few days uses his Weiss Wave for another angle on the US index ------------- BC User since June 2007 |
Posted By: todbull
Date Posted: 31 Aug 2015 at 10:22pm
|
Hi cmacdon Thanks for that programming. Been looking for something like this for ages, as it seems the true way to interpret volume and should help immensely with swing trading. I have used it and after doing some research and checking on Weis, noticed that the parameters for cumulative and average volume are reversed. ie. imo using parameter 2 for total/cumulative is the Weis way. Also Weis wave uses the cumulative volume number shown on the price chart at each pivot point. Whereas in this it shows the price pivot. When doing more research on Weis and looking at video examples of his method, he definitely does not use volume at all. Rather uses cumulative volume for each wave and his method shows this number on each pivot point. He shows that u cant interpret time based volume as a force for each wave and that the cumulative volume number for each of the waves, is a must for interpretation of what is next. So question is - any chance of updating this for these points? Or can u point me in a direction where I can get it done. |
Posted By: cmacdon
Date Posted: 01 Sep 2015 at 6:57am
|
Hi Todbull The mixed narrative is easy to change. Reverse my typing narrative within the quotations in the original line of code from this:
v1:=input("1=Totalvolumeonwaveor2=Averagevolumeonwave",2,1,2);
To something like this:
v1:=input("1=Ave vol wave or 2=Tot volume wave",2,1,2); You do not have to change anything else in the code.as it correctly calculates the Total accumulated volume on a wave or the Average volume on a wave, as shown in the two images below. I will not change the Coding for indicator the Top Chart as it is just a ZIG Zag type indicator that shows the price of the peak or trough. In BC to read the Total Volume on a corresponding wave just hover your mouse over the end of the Total Volume Wave in the bottom panel indicator and a little narrative will appear that tells you the Total volume on that wave. However for the average volume calculation that option, hovering the mouse, does not work (it is just a BC quirk) but you add a horizontal line to the bottom panel to read the average volume from the right hand scale as per the second image below. I will address your comments on the Weis approach in second part of this reply. ------------- BC User since June 2007 |
Posted By: cmacdon
Date Posted: 01 Sep 2015 at 7:32am
|
Todbull I had trouble loading the two images so they are shown further below. With respect to your comments about David Weis's methods. David uses quite a lot of different variations for his indicator tool set which I also bought after the original of the above two total and average volume wave indicators were posted on this Forum. My interest at the time was only in Total and average volume on waves as I like the Ord Volume approach and also the Weis approach. I have Weis's videos and books so I am not sure why you say Weis sometimes does not use volume at all. Weis is a renowned Wyckoff expert and volume is extremely important to that type of analysis. Just read his latest book Trades about to Happen. However, Weis, like Wyckoff, sometimes choses to use Point and Figure charts to project where he believes price will rise of fall after a period of congestion. P&F Charts do not rely on Volume as it is a price amplitude only technique for understanding the markets but that is not the purpose of his Weis Wave approach. Some times when volume data is not available he just uses time as a substitute for Volume in his calculations, as he says time and volume are close substitutes, so he is being a bit like Gann in some instances. However I am now writing a book based on understanding the approaches of a number of the Trading Masters from the last 115 years and building on their approaches with new supply and demand indicators. The book will come out shortly. The new indicators go well beyond my original indicator settings above as I can calculate the gross buying and gross selling volume within bars and across bars so it is very much like understanding a micro economic supply and demand on up waves and down waves. Properly understood and measured supply and demand does drive prices higher or lower. In my opinion, is a much better approach than looking purely at Total Volume or average volume waves. The indicators can be used in conjunction with other techniques that in the past only relied on time and price dimensions e.g. Hurst Cycles, Elliott Wave, and Merrill Filtered Waves etc. Down the track I intend to make available, in one form or another, Bullscript as well as another trading software version of the indicators. If I can get the imaging up load working on this Forum I will upload some images of the indicators at work later on. Charles
------------- BC User since June 2007 |
Posted By: cmacdon
Date Posted: 01 Sep 2015 at 9:58am
 ------------- BC User since June 2007 |
Posted By: cmacdon
Date Posted: 01 Sep 2015 at 9:59am
|
The horizontal bar below in the bottom panel reflects to last volume wave height from the right edge. To see the Total volume on any wave in the bottom panel hover the mouse cursor over the last bar on the volume wave. 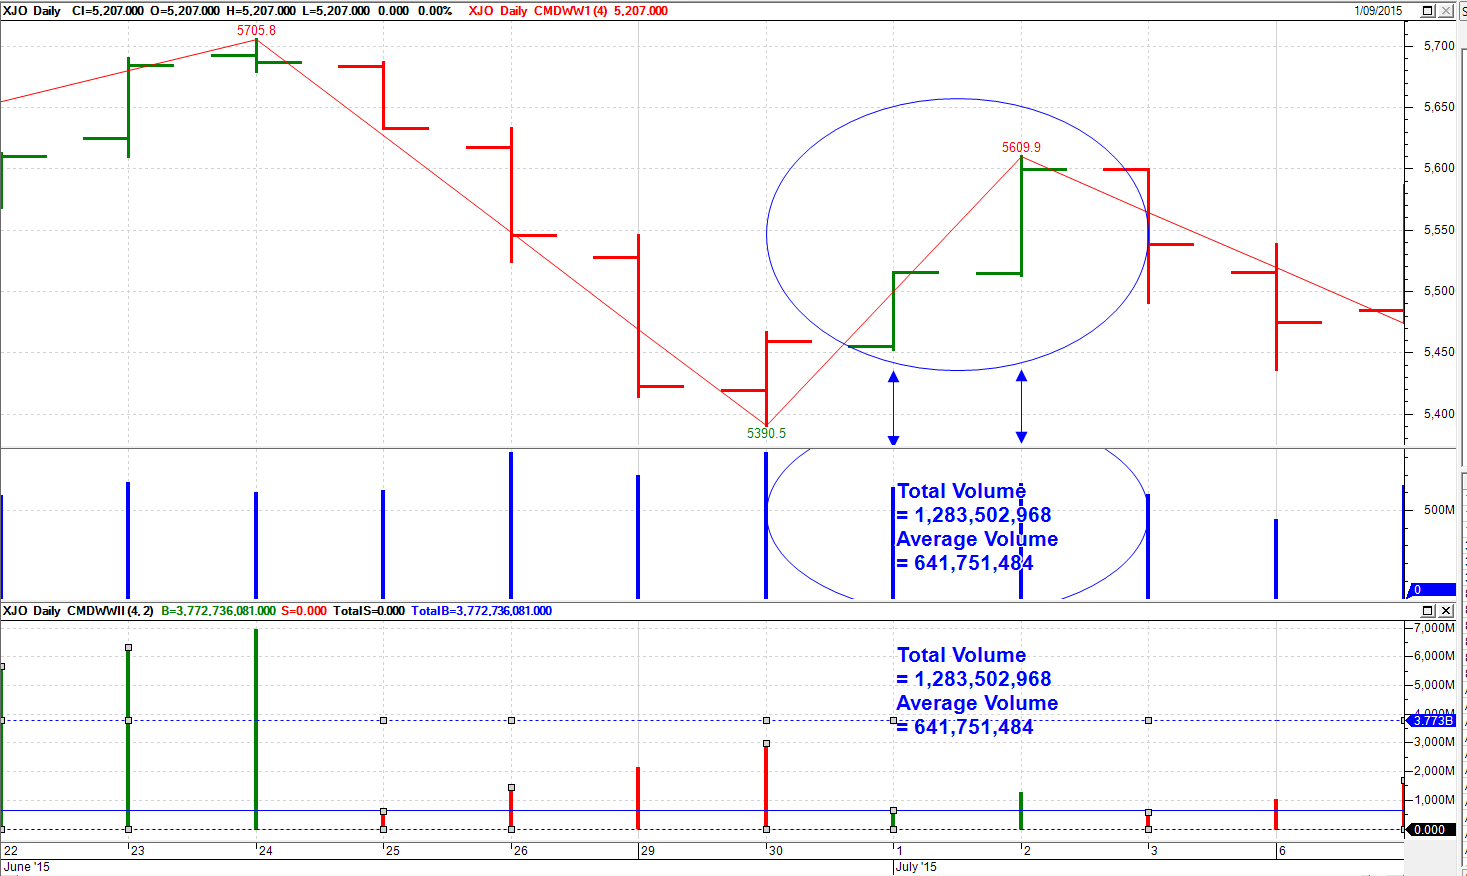 ------------- BC User since June 2007 |
Posted By: cmacdon
Date Posted: 01 Sep 2015 at 10:03am
|
Using the Average Vol wave the Hovering mouse option does not work in BC so draw a horizontal line to read the average volume on the right hand scale.  ------------- BC User since June 2007 |
Posted By: todbull
Date Posted: 01 Sep 2015 at 11:54am
|
Charles, Sorry for my ignorance about the volume statement. Only last night watching the video, I must have picked up something out of context, regards his Weis wave video, with my little knowledge of the subject.
Ordered his book yesterday and I would certainly be buying your book. Where can one find about buying your book/indicators when it is released? |
Posted By: cmacdon
Date Posted: 01 Sep 2015 at 3:07pm
|
TodBull We all have to learn. From my intro. Charles "Knowledge is more powerful than gold.”...
"Never think that you know it all. I have been studying Stocks and
Commodities for forty years, and I do not know it all yet. I expect to continue to learn something every
year as long as I live,” file:///C:/Users/cmacdon/Documents/Book%20Publish%20Version%208.5%20x11/Larger%20chapter%20book%20%288.5x11%29%28v1.04%29PDF%20Trial%20-.docx#_ftn1 - … "remember you can never have too much
knowledge. Continue to study and learn
more for knowledge can always be turned into profits later." file:///C:/Users/cmacdon/Documents/Book%20Publish%20Version%208.5%20x11/Larger%20chapter%20book%20%288.5x11%29%28v1.04%29PDF%20Trial%20-.docx#_ftn2 - -
file:///C:/Users/cmacdon/Documents/Book%20Publish%20Version%208.5%20x11/Larger%20chapter%20book%20%288.5x11%29%28v1.04%29PDF%20Trial%20-.docx#_ftnref1 - - W. D. Gann, How to make profits from trading in commodities, Lambert-Gann publishing 1942, Unnumbered page immediately after the Index. file:///C:/Users/cmacdon/Documents/Book%20Publish%20Version%208.5%20x11/Larger%20chapter%20book%20%288.5x11%29%28v1.04%29PDF%20Trial%20-.docx#_ftnref2 - - W. D. Gann, Speculation as a profitable profession, A Course of Instructions on Grains, 1954, p 11 ------------- BC User since June 2007 |
Posted By: paulchow2k
Date Posted: 21 Feb 2016 at 4:13pm
|
Its getting harder to use VSA nowadays as Bullcharts doesn't quite show ALL the volume of a security just yet. Perhaps later versions will. P
|
Posted By: cmacdon
Date Posted: 21 Feb 2016 at 11:50pm
|
Paul I am not sure what exactly is the problem you are finding with the BC Volume by the end of day. What are you comparing the BC volume to? I know that e-signal does not post the correct EOD volume until the opening of the next day and that has always been an issue for the tradeguider people using EOD prices but the delayed volume is not out until the next morning but they do not always run TG with e-signal data feedsas they have several platorms they can run on which do not need e-signal. Intraday there should be no difference as the volume data is not waiting for an exchanges to confirm the total volume data for the day. Even the ASX volume is not confirmed until after 7.00 when BC does it's final update. Regards Charles ------------- BC User since June 2007 |
Posted By: rbbrain
Date Posted: 24 Feb 2016 at 2:26pm
|
Hi paulchow2k, and all, The BC data only shows the volumes transacted on the ASX exchange. Knowing that our second exchange operator in Australia (Chi-X) now handles about 20 percent of the daily volume (across something like 50?? stocks), we know that the BC volumes will be lower than total volume for some stocks. See the Chi-X web site for details: http://au.chi-x.com/ - http://au.chi-x.com/ ------------- Convenor - Australian BullCharts User Group http://www.RobertBrain.com - Brainy's Share Market Toolbox and BullCharts Tips [/CENTER |