Bear Market Bottom – Favourite BC Indicators?
Printed From: BullCharts Forum
Category: BullCharts
Forum Name: Off Topic
Forum Discription: General conversation not specifically related to BullCharts.
URL: http://www.bullcharts.com.au/forum/forum_posts.asp?TID=528
Printed Date: 03 May 2024 at 6:37am
Software Version: Web Wiz Forums 9.69 - http://www.webwizforums.com
Topic: Bear Market Bottom – Favourite BC Indicators?
Posted By: rbbrain
Subject: Bear Market Bottom – Favourite BC Indicators?
Date Posted: 29 Nov 2008 at 10:35am
|
Bear Market Bottom – Favourite BullCharts Indicators? In the 270 odd indicators supplied with BullCharts, there must be a couple of indicators that will help indicate a turning point. Or, perhaps you have written your own BullCharts indicator? Question: What is your favourite indicator to help spot a bear market bottom? If you have different ideas about a bear market bottom, then please post it in another Topic, or if you can't find one, create a New Topic like this one. CAUTION: Any information on this forum is general in nature. Nothing that you read here can be construed as financial advice. Any information here is just for discussion and education. Your own personal financial situation has not been considered. THIS FORUM DOES NOT CONTAIN INVESTMENT ADVICE!! ------------- Convenor - Australian BullCharts User Group http://www.RobertBrain.com - Brainy's Share Market Toolbox and BullCharts Tips [/CENTER |
Replies:
Posted By: peter1
Date Posted: 29 Nov 2008 at 3:14pm
|
One indicator that I am spending more time looking at is the Relative Strength Comparison (RSC) ribbon. You will find this indicator in the "All Ribbons" category, under the Insert Indicator menu tab. This indicator requires two inputs, a stock code and a time period for the comparison. I create and display two RSC ribbons on my charts. I use the XAO index and the time periods of 5 and 15. One for the short term and a longer one for the medium term. I use this as a screening tool so that I spend my time looking at charts more efficiently. The RSC ribbon turns green when the stock price performs better than the XAO. These are the stocks I want to be looking at as I want my SF to perform better than the index. Once RSC has located the charts then I do not look at RSC again as I am looking for my buy signals which are based on price patterns. I use the RSC ribbon to hunt in bear markets only. (You might like to create two ribbons showing a different view. One ribbon with an index and another for the sector so that you are seeing the stocks that are performing better than their sector as well as the market.) Here are some examples. These snapshots are weekly charts. 
|
Posted By: kmuntz
Date Posted: 29 Nov 2008 at 4:25pm
|
When the MACD comes up through the signal line from below the zero line it's often (but not always) a signal of a change in direction. On a weekly chart of XAO it clearly did this in March 2003 which was very early into the bull market. There was a false signal in November 2002. We had a false signal in April 2008 but now the MACD is levelling out and if prices go up a bit more it will rise and cross its signal line - this hopefully won't be a false signal. It will probably work well on a monthly chart too but it will be 2-3 months after the true bottom as it can only turn when the monthly data turns and it's still down on even last month. The Coppock indicator will add confirmation but you will miss the first 2 or 3 months of the turn around. That is the price you pay for more safety. It's easy in retrospect to say "I should have bought BHP last week near $20" but really it's guessing at the time because it could have gone lower. |
Posted By: rbbrain
Date Posted: 09 Dec 2012 at 10:11am
|
COPPOCK Indicator *************** Many people like to watch the Coppock indicator from month to month (designed to suggest turning points at market bottoms). Take a look at what it has done in the last couple of months (since June 2012), and compare this dip in the Coppock to the previous dips in Coppock. Is this now signalling a market bottom? 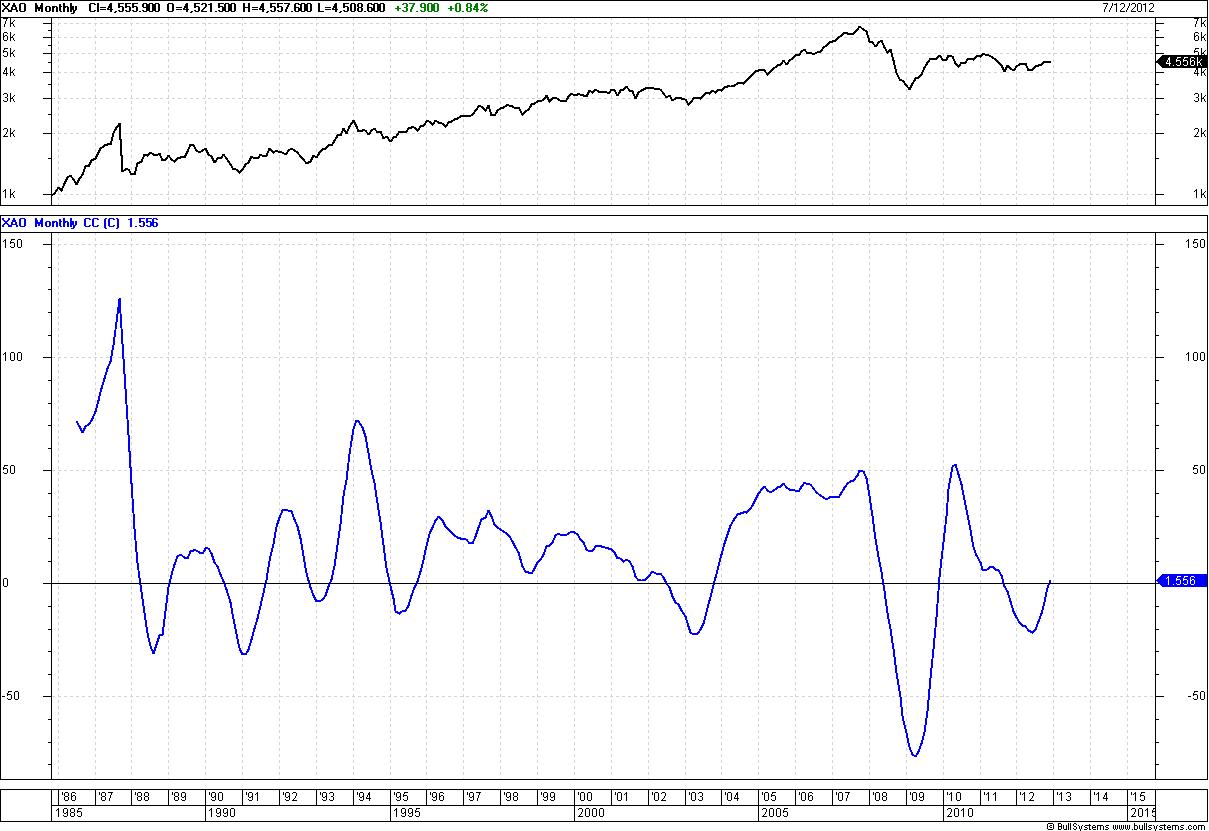 ------------- Convenor - Australian BullCharts User Group http://www.RobertBrain.com - Brainy's Share Market Toolbox and BullCharts Tips [/CENTER |
Posted By: rbbrain
Date Posted: 02 May 2020 at 9:58am
|
With a severe bear market in place in 2020, due to the global
coronavirus pandemic, bear market bottom hunting will be the discussion
topic in the May 2020 User Group meeting/webinar. Any early thoughts on
the topic related to favourite chart indicators can be posted here in the user forum. ------------- Convenor - Australian BullCharts User Group http://www.RobertBrain.com - Brainy's Share Market Toolbox and BullCharts Tips [/CENTER |