Stan Weinstein: BC RS vs. Mansfield Charts RS |
Post Reply 
|
| Author |
 Printable Version Printable Version Delicious Delicious Digg Digg Facebook Facebook Furl Furl Google Boomarks Google Boomarks Google Buzz Google Buzz MySpace MySpace Newsvine Newsvine reddit reddit StumbleUpon Translate StumbleUpon Translate Twitter Twitter Windows Live Windows Live Yahoo Bookmarks Yahoo Bookmarks Topic Search Topic Search  Topic Options Topic Options
|
charlie_8 
Regular 
Joined: 06 Apr 2011 Posts: 21 |
 Post Options Post Options
 Quote Reply Quote Reply
 Topic: Stan Weinstein: BC RS vs. Mansfield Charts RS Topic: Stan Weinstein: BC RS vs. Mansfield Charts RSPosted: 06 May 2015 at 4:20am |
|
Hello dear BC users,
a couple weeks ago I came across a Amibroker code, that seems to be a good reflection of original RS of Mansfield Charts. I don´t know, what data Mansfiled Chart used for benchmarking (I'm using S&P500 Index), may be they have used any industry or sector averages. I compared pictures of 2 stocks from the book (GT and IBM) with charts from Amibroker and BC. we could see more or less comparable results in Amibroker and totally disagreement with BC. :( here is the formula: ____________________________________________________ maPeriod = Param( "MA Period", 52 * 5, 0, 500, 1 ); rsSymbol = ParamStr( "Base Index Symbol", "^GSPC" ); rs = RelStrength( rsSymbol ); rsMan = ( rs / MA( rs, maPeriod ) ) - 1; dynColor = IIf( rsMan >= 0, colorLime, colorRed ); Plot( rsMan, "RS Mansfield", dynColor, styleArea ); ______________________________________________________ 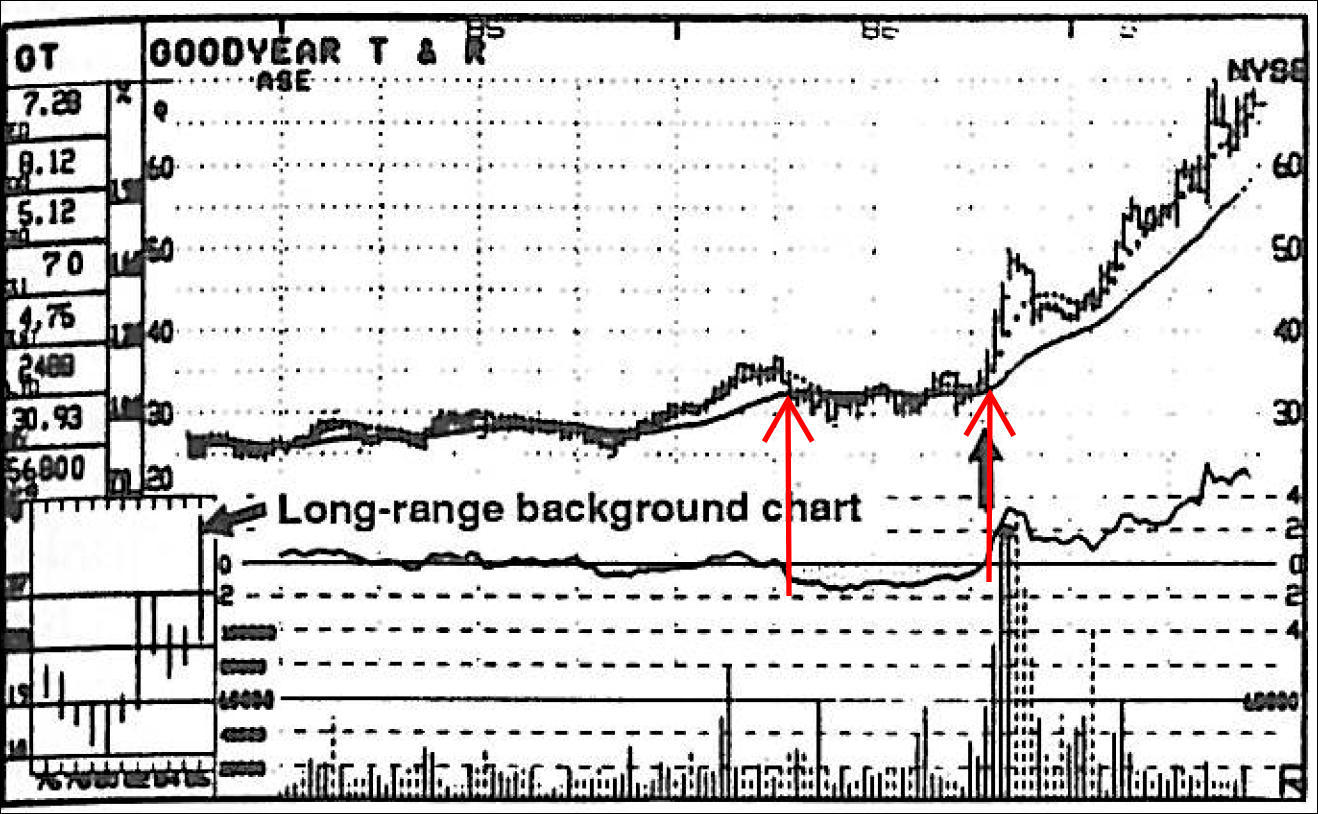      Edited by charlie_8 - 06 May 2015 at 8:07pm |
|
 |
|
|
charlie_8
Regular
Joined: 06 Apr 2011 Posts: 21 |
Post Options
Quote Reply
Posted: 06 May 2015 at 8:11pm |
|
I edited my post today, because all the pictures were lost.
|
|
|
|
|
cmacdon
BullCharts Guru 
Joined: 09 Sep 2012 Location: Brisbane Posts: 236 |
Post Options
Quote Reply
Posted: 09 May 2015 at 8:26am |
|
Charlie-8
I am not sure what Mansfied charts are about but there used to be a post I thought from BC, somewhere on this forum saying there was a problem with the Stan Weinstein stage indicators on BC; so, I would check with BC whether whatever the problem was, in that indicator, has since been fixed. |
|
|
BC User since June 2007
|
|
|
|
|
paulchow2k
Newbie 
Joined: 15 Oct 2010 Posts: 7 |
Post Options
Quote Reply
Posted: 03 Jul 2015 at 4:22pm |
|
I used to think Relative Strength [Relative Compartive] is relative to the index of the country so if it's IBM, it's part of the DOW Jones ^DJI rather than the S&P 500 index. In Australia though that would have to be part of either the XJO or XAO although that being said, our market is so small we can just pull the index of that sector compared to the XAO/XJO index.
p |
|
|
|
|
Post Reply
|
| Forum Jump | Forum Permissions You cannot post new topics in this forum You cannot reply to topics in this forum You cannot delete your posts in this forum You cannot edit your posts in this forum You cannot create polls in this forum You cannot vote in polls in this forum |


