LBR Trend and JB Profit taking indicator |
Post Reply 
|
| Author |
 Printable Version Printable Version Delicious Delicious Digg Digg Facebook Facebook Furl Furl Google Boomarks Google Boomarks Google Buzz Google Buzz MySpace MySpace Newsvine Newsvine reddit reddit StumbleUpon Translate StumbleUpon Translate Twitter Twitter Windows Live Windows Live Yahoo Bookmarks Yahoo Bookmarks Topic Search Topic Search  Topic Options Topic Options
|
cmacdon 
BullCharts Guru 
Joined: 09 Sep 2012 Location: Brisbane Posts: 236 |
 Post Options Post Options
 Quote Reply Quote Reply
 Topic: LBR Trend and JB Profit taking indicator Topic: LBR Trend and JB Profit taking indicatorPosted: 29 Dec 2012 at 7:13pm |
|
About a month ago I searched the internet and found a PDF named Professional Trading Techniques by Linda Bardford Rashke. It apparently downloads from her Website LBR .com but on looking at the site I coulod not locate it. On further searches I recollect that Aspen Graphics who LBR apparenmtly consults to may offer it to users.
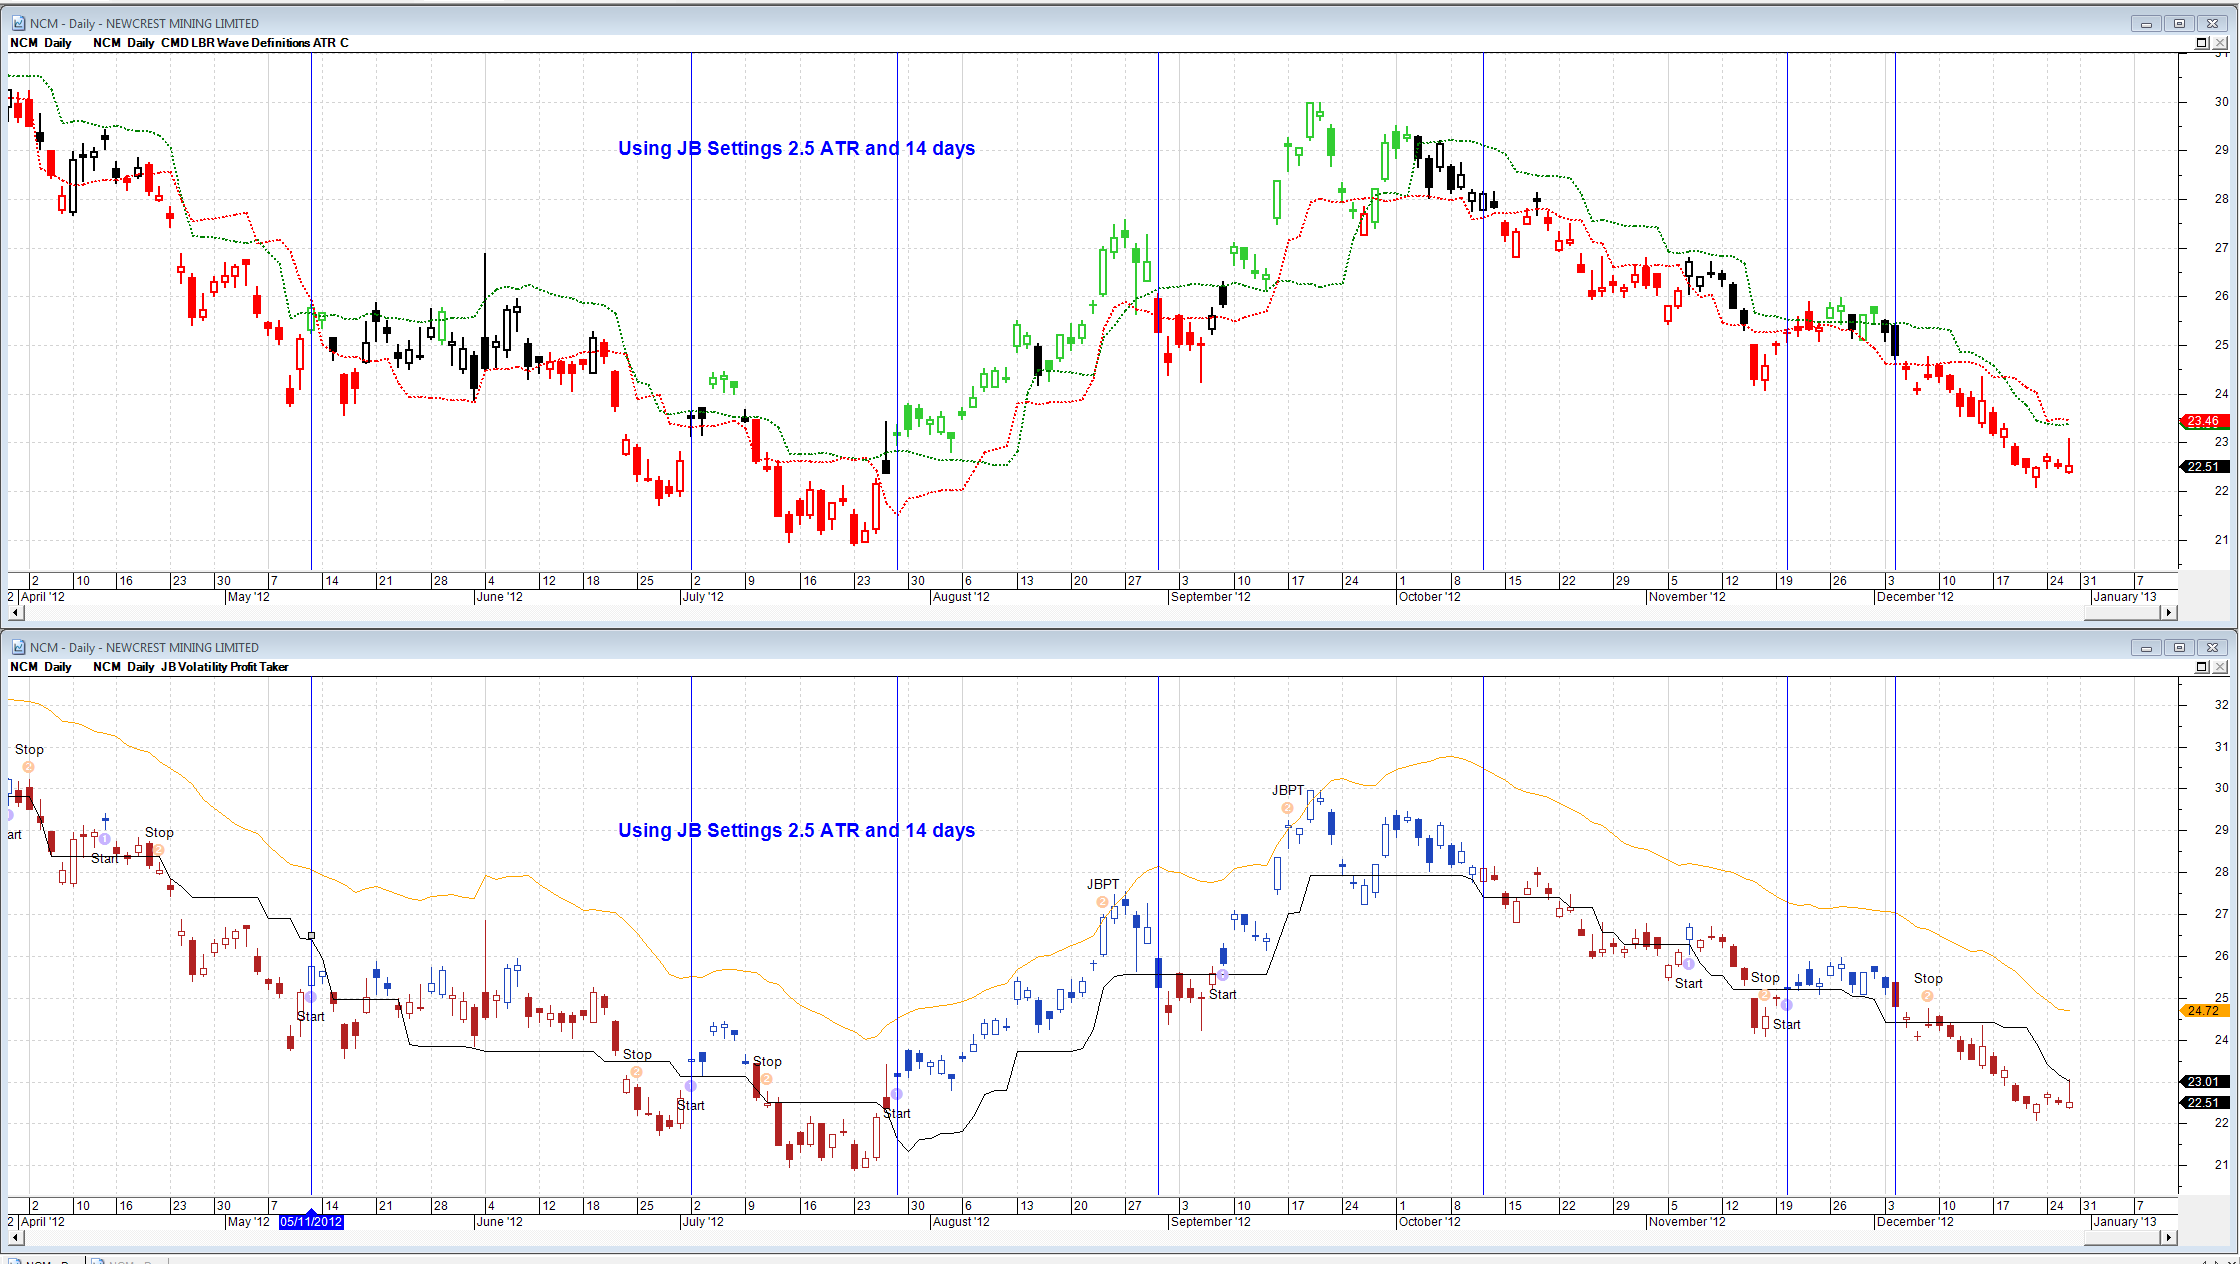
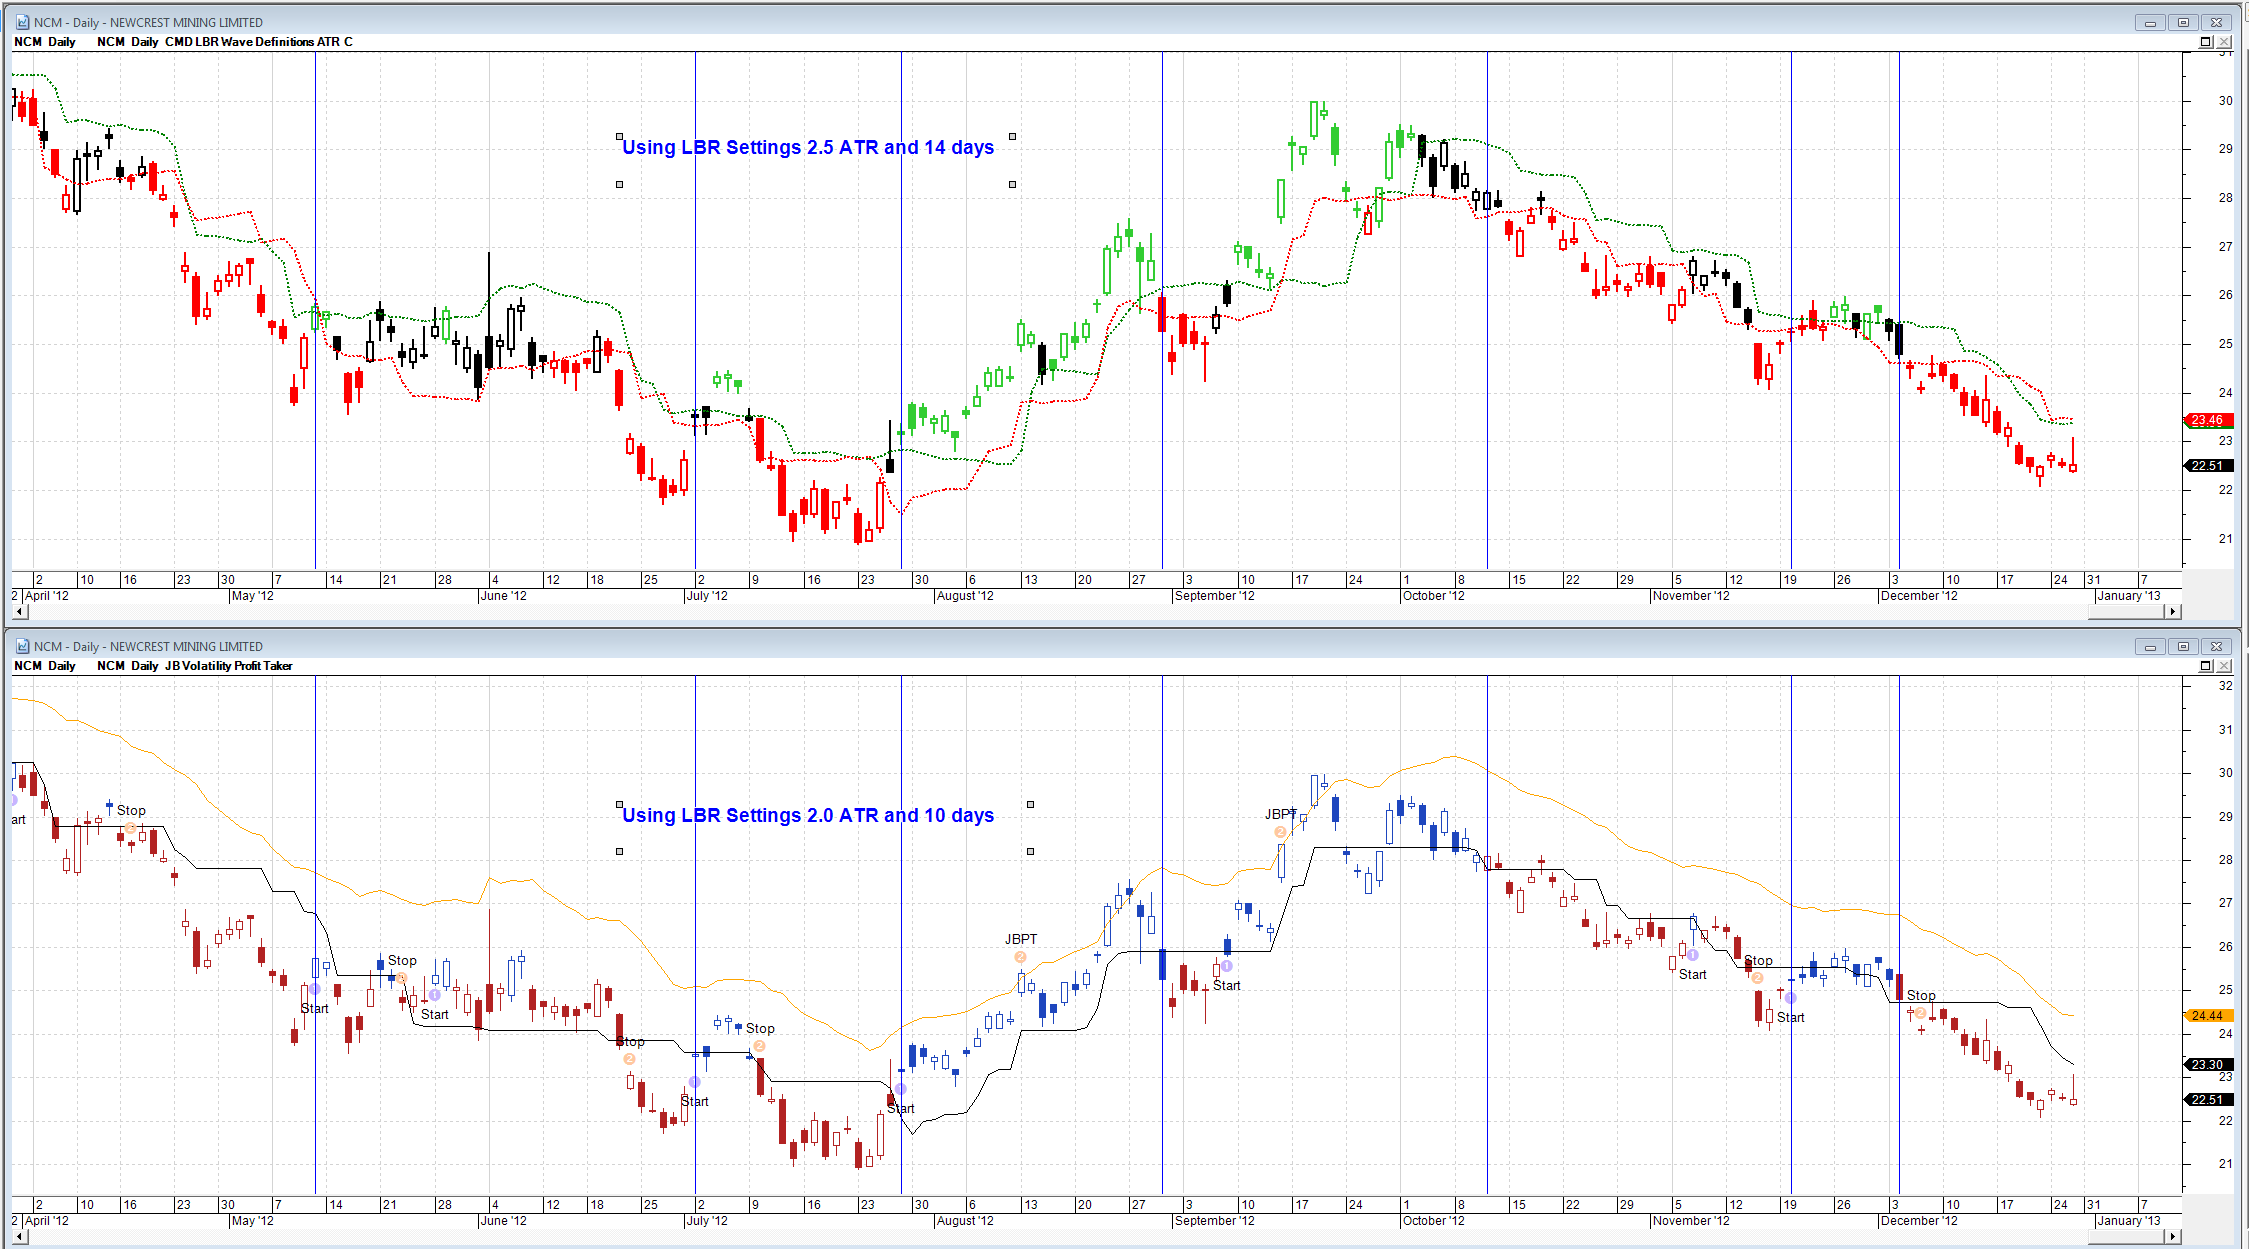
It is a very good manual and on page 15 is a description of the "Defining the Trend" system that LBR apparently uses in back testing that I coded in Bullscript. By conincidence today, I was contacted today by a Forum member about the JB Profit taking indicator which I advised I have never used and do not know what it is about.However, having having looked at the Bullcharts JB Profit taking indicator applied to a chart I advised it is very similar to Linda Bradford Rashke's Trend indicator that she uses for backtesting. The main difference seems to be that LBR uses 2.5 ATR and 14 days in her parameters and JB uses 2.0 ATR and 10 days in his parameters. Accordingly I advised the forum member I would post my code for the LBR Trend indicator and here are some chart comparriosn and the code I adapted for the LBR Trend indicator. This will be posted in a few miniutes. |
|
|
BC User since June 2007
|
|
 |
|
|
cmacdon
BullCharts Guru
Joined: 09 Sep 2012 Location: Brisbane Posts: 236 |
Post Options
Quote Reply
Posted: 29 Dec 2012 at 8:32pm |
|
Here are comparativer charts with various settings
 |
|
|
BC User since June 2007
|
|
|
|
|
cmacdon
BullCharts Guru
Joined: 09 Sep 2012 Location: Brisbane Posts: 236 |
Post Options
Quote Reply
Posted: 29 Dec 2012 at 8:33pm |
|
|
|
BC User since June 2007
|
|
|
|
|
cmacdon
BullCharts Guru
Joined: 09 Sep 2012 Location: Brisbane Posts: 236 |
Post Options
Quote Reply
Posted: 29 Dec 2012 at 8:33pm |
|
|
|
BC User since June 2007
|
|
|
|
|
cmacdon
BullCharts Guru
Joined: 09 Sep 2012 Location: Brisbane Posts: 236 |
Post Options
Quote Reply
Posted: 29 Dec 2012 at 8:40pm |
|
{cmacdon code for Trend Indicator from LBR Professional Trading Manual p 15} [target =Price;] n := input("Time periods for highest high",14); type := input("Is this Stop for 1 Long or 2 Short",1); S2 := input("No. of ATRs multiplier",2.5); Upwave:= If(type=1,Lowest(L,n)+((atr(n))*s2),undefined); [color = Green; linestyle=Dotted; width=2;] Upwave; Downwave:= If(type=1,Highest(h,n)-((atr(n))*s2),undefined); [color = Red; linestyle=Dotted; width=2;] Downwave; [target =Price; linestyle=PriceColor]
[name =Downwave; Color=Lime Green] {Downwave} If ( C>=Upwave,1,undefined); [name =High Vol; Color=Red] {Upwave} If (C<=Downwave,1,undefined); |
|
|
BC User since June 2007
|
|
|
|
|
cmacdon
BullCharts Guru
Joined: 09 Sep 2012 Location: Brisbane Posts: 236 |
Post Options
Quote Reply
Posted: 30 Dec 2012 at 10:05am |
|
I forgot to add this version yesterday.
I have a variation of the LBR Trend indicator using OR statements in the indicator wave definitions. Thiis version is not from the LBR Manual mentioned above overcomes some potnetil whipsaws in up trends so may get you in earlier and stay longer. On down trends may show green bars that might otherwise be a truning point. So as usual trader beware. 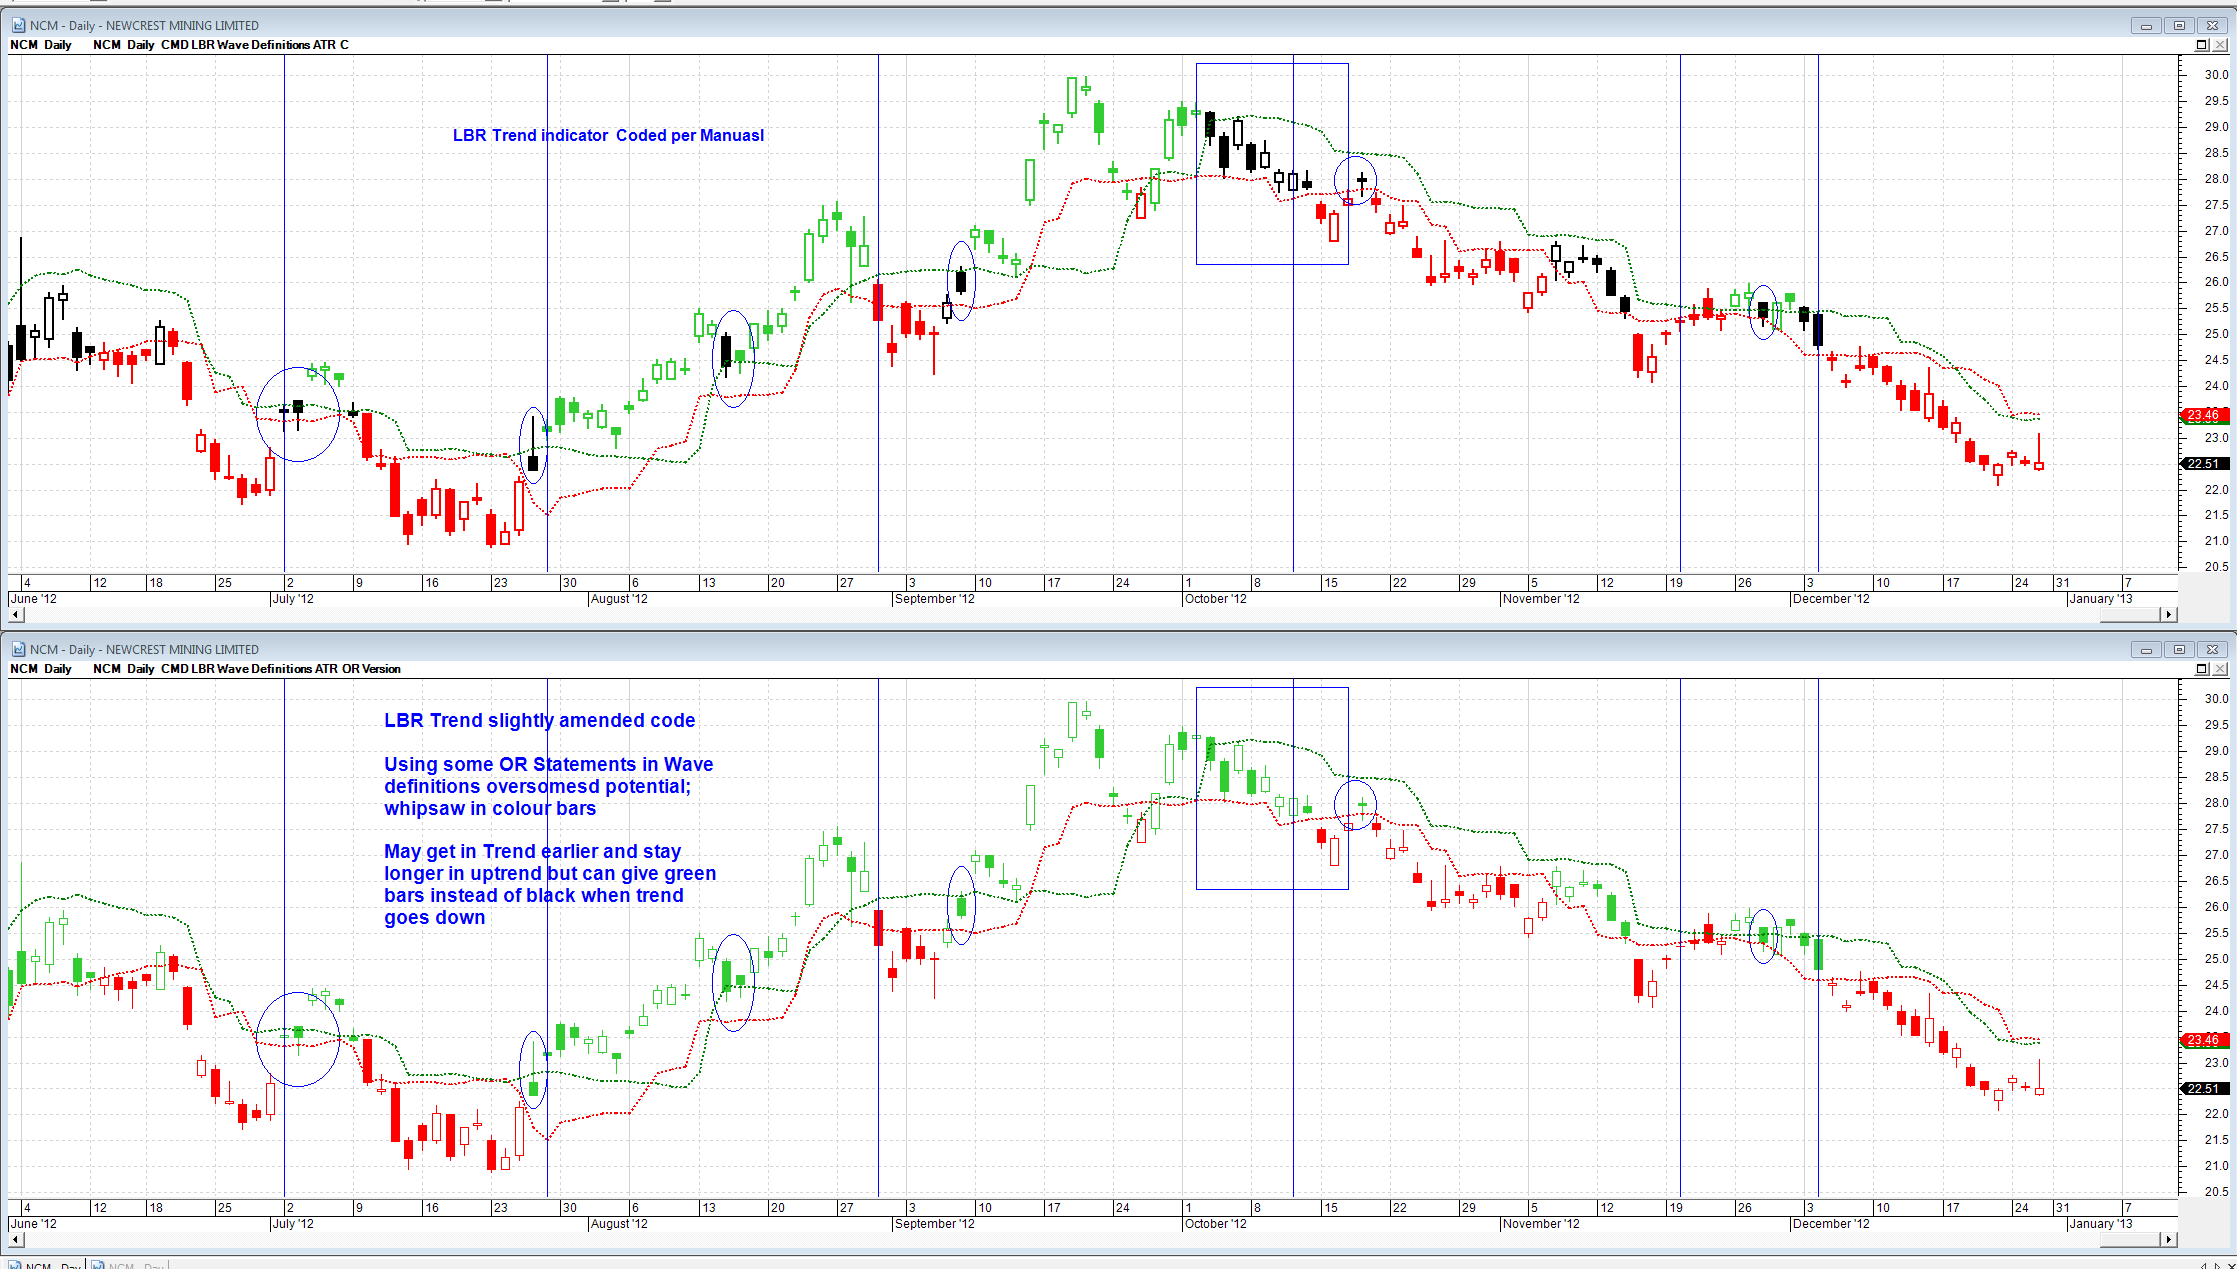 |
|
|
BC User since June 2007
|
|
|
|
|
cmacdon
BullCharts Guru
Joined: 09 Sep 2012 Location: Brisbane Posts: 236 |
Post Options
Quote Reply
Posted: 30 Dec 2012 at 10:08am |
|
Code with the OR Statements is below:
{Mainly Per LBR Manual p 15 but Amended with OR statements in the Wave definitions} [target =Price;] n := input("Time periods for highest high",14); type := input("Is this Stop for 1 Long or 2 Short",1); S2 := input("No. of ATRs multiplier",2.5); Upwave:= If(type=1,Lowest(L,n)+((atr(n))*s2),undefined); [color = Green; linestyle=Dotted; width=2;] Upwave;
Downwave:= If(type=1,Highest(h,n)-((atr(n))*s2),undefined); [color = Red; linestyle=Dotted; width=2;] Downwave;
[target =Price; linestyle=PriceColor]
[name =Downwave; Color=Lime Green] {Downwave} If ( C>=Upwave OR C>=DownWave,1,undefined); [name =High Vol; Color=Red] {Upwave} If (C<=Downwave OR C<=DownWave,1,undefined); |
|
|
BC User since June 2007
|
|
|
|
|
Post Reply
|
| Forum Jump | Forum Permissions You cannot post new topics in this forum You cannot reply to topics in this forum You cannot delete your posts in this forum You cannot edit your posts in this forum You cannot create polls in this forum You cannot vote in polls in this forum |


