Bollinger Breach in last 3 Days |
Post Reply 
|
| Author |
 Printable Version Printable Version Delicious Delicious Digg Digg Facebook Facebook Furl Furl Google Boomarks Google Boomarks Google Buzz Google Buzz MySpace MySpace Newsvine Newsvine reddit reddit StumbleUpon Translate StumbleUpon Translate Twitter Twitter Windows Live Windows Live Yahoo Bookmarks Yahoo Bookmarks Topic Search Topic Search  Topic Options Topic Options
|
gunnatrada 
Newbie 
Joined: 14 Jan 2009 Posts: 8 |
 Post Options Post Options
 Quote Reply Quote Reply
 Topic: Bollinger Breach in last 3 Days Topic: Bollinger Breach in last 3 DaysPosted: 09 Apr 2012 at 11:27am |
|
Hello all,
I run the default BullScan "Bollinger Breach in last 3 Days". Somehow the Bolliger Band indicator is automatically added when I open the charts from the scan results. I have not seen this sort of thing happen with any of the other default scans. Can anyone explain how the Bollinger Band indicator is automatically added to the scan result charts. GunnaTrada (one day) |
|
 |
|
|
rbbrain
BullCharts Staff 

Joined: 22 Jul 2006 Location: Melbourne Posts: 169 |
Post Options
Quote Reply
Posted: 10 Apr 2012 at 9:42am |
|
Hi GunnaTrada,
The observation you describe is a feature of the BullScan module. When running a scan, any indicator that is specified in the Scan Criteria will produce another column in the Scan Results Table. Then when you create a chart from that table (either double-click on a stock in the list, or use the toolbar button to create a chart), BullCharts will automatically resize the current window "panes" (the price charts etc), and it will add onto the chart any indicators mentioned in the Scan Criteria (which produced the extra columns in the Results Table). Also note there is an item in the Scan Criteria to "Show this item" instead of just comparing two items. There are a lot of options there. I hope this helps answer your question. Cheers |
|
|
Convenor - Australian BullCharts User Group Brainy's Share Market Toolbox and BullCharts Tips [/CENTER |
|
|
|
|
gunnatrada
Newbie
Joined: 14 Jan 2009 Posts: 8 |
Post Options
Quote Reply
Posted: 12 Apr 2012 at 3:56pm |
|
Thanks Brainey
I'm happy now that I know why the Bollinger band indicater is placed on the chart. My next question is why does a breach of the upper or lower Bollinger band get displayed if it is more than 3 days ago? FOr example FLT Flight Centre GunnaTrada |
|
|
|
|
rbbrain
BullCharts Staff
Joined: 22 Jul 2006 Location: Melbourne Posts: 169 |
Post Options
Quote Reply
Posted: 12 Apr 2012 at 4:27pm |
|
Hi,
From your earlier post, I believe you are running the scan (screen shot of scan criteria shown included below), which says "High is greater than the BB Top..." OR "Low is less than BB Bottom"... any bar in the last 3 bars. And the default scan is run on Daily data (see the "Data period type"). And when I look at the FLT price chart with the standard BB applied, I agree. I can't see that FLT has met either of these two optional criteria. I would guess that there is some other explanation. It would be useful to observe a couple of things about the resulting scan results table, and the vertical red dotted line on the default chart which is labelled "Scan Date" - to confirm which date was used in the scan as the "Scan as at..." date. 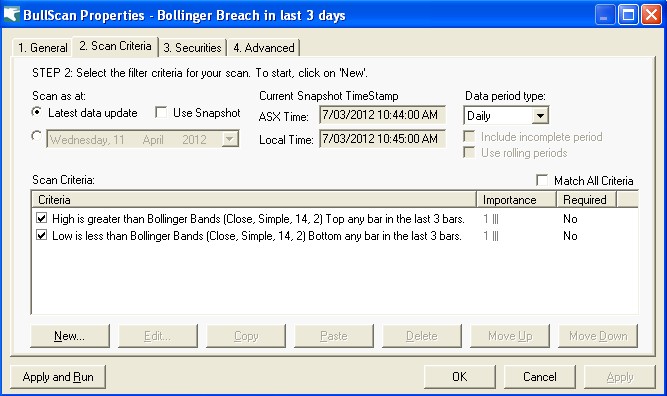 Hoping we can help get to the bottom of it. Cheers |
|
|
Convenor - Australian BullCharts User Group Brainy's Share Market Toolbox and BullCharts Tips [/CENTER |
|
|
|
|
gunnatrada
Newbie
Joined: 14 Jan 2009 Posts: 8 |
Post Options
Quote Reply
Posted: 12 Apr 2012 at 5:46pm |
|
Hello Brainy
My scan is the same as the one above except for the snapshot dates. I do not know about these whether important or not. I am guessing not. It is interesting that I just run the scan again now and FLT was rejected. However AAC was accepted even though it did not meet the criteria. I'm still confused Thanks GunnaTrada |
|
|
|
|
gunnatrada
Newbie
Joined: 14 Jan 2009 Posts: 8 |
Post Options
Quote Reply
Posted: 12 Apr 2012 at 5:58pm |
|
Hello Brainy
I tried to insert the image in my last post but something went wrong this is an attempt to again insert the AAC Chart GunnaTrada 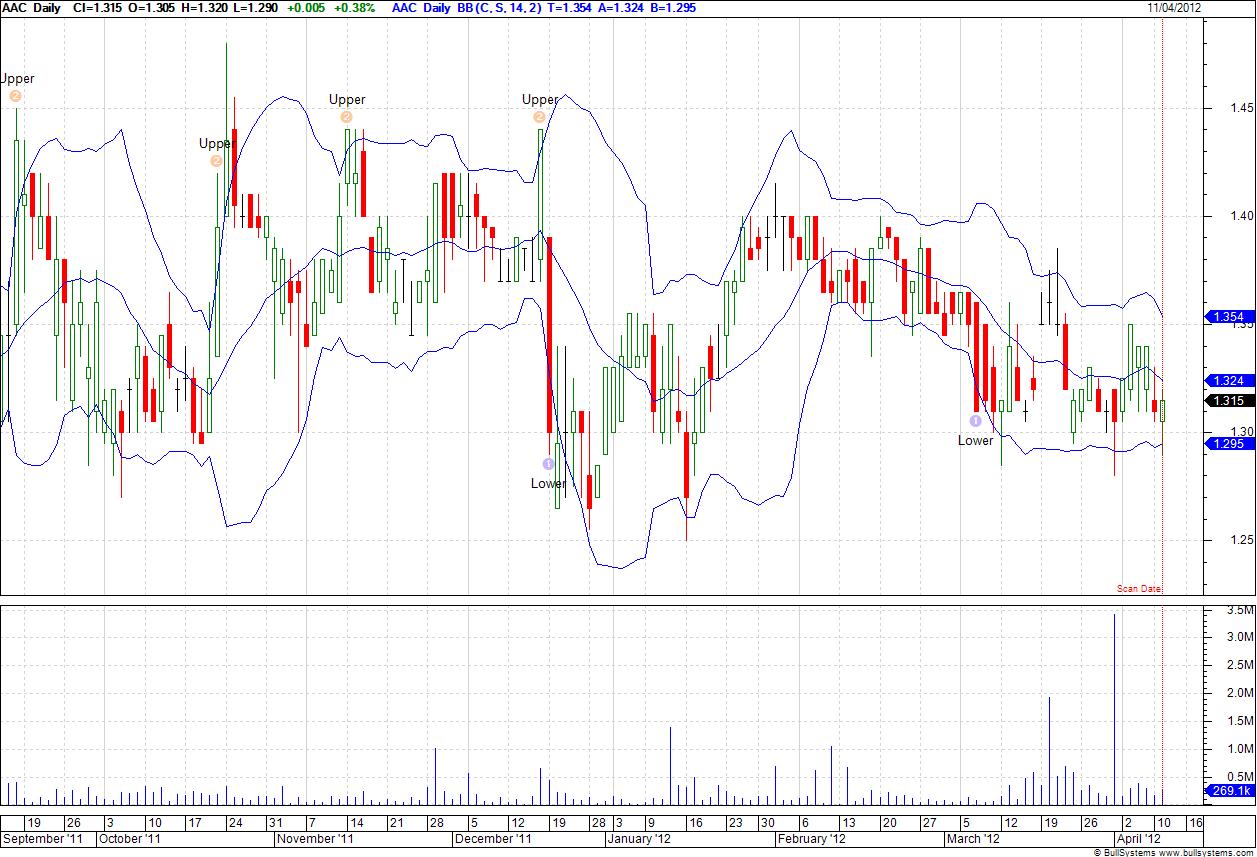 |
|
|
|
|
rbbrain
BullCharts Staff
Joined: 22 Jul 2006 Location: Melbourne Posts: 169 |
Post Options
Quote Reply
Posted: 12 Apr 2012 at 6:05pm |
|
Hi.
In the chart of AAC we can see that on the last candle, the spike low for the day penetrated the BB bottom. The scan criteria does say "or... Low less than BB bottom". So this one does meet the criteria in this particular scan. If you don't want to see any of the penetrations of the Lower band, then in the Scan Criteria you can uncheck this criteria item, and then it will only search for the upper band penetrations. Cheers |
|
|
Convenor - Australian BullCharts User Group Brainy's Share Market Toolbox and BullCharts Tips [/CENTER |
|
|
|
|
gunnatrada
Newbie
Joined: 14 Jan 2009 Posts: 8 |
Post Options
Quote Reply
Posted: 13 Apr 2012 at 7:20pm |
|
Hello Brainy
All my problems were misunderstandings on my part. I now know how to do a scan and have an indicator automatically placed on the scan results charts. Also I have learned to look more closely at the scan criteria. I mistakenly believed the Bollinger Breach in the last 3 days scan was looking for a close either above the upper band or below the lower band. I jumped to this conclusion because the Bollinger Band indicator Looks for any close above or below the upper or lower band. I realise now (after you pointed it out) that the scan is actually looking for a high above or a low below the bands. I am pleased you were patient and politely set me straight. Thank you GunnaTrada |
|
|
|
|
rbbrain
BullCharts Staff
Joined: 22 Jul 2006 Location: Melbourne Posts: 169 |
Post Options
Quote Reply
Posted: 14 Apr 2012 at 10:05am |
|
Hi GunnaTrada,
Many of us go through the learning periods with stuff like this, and we need to ask lots of questions. It's quite okay to ask all the questions, and we are all very happy to be able to help out. I am glad I have been able to help out. Feel free to ask some more... Cheers |
|
|
Convenor - Australian BullCharts User Group Brainy's Share Market Toolbox and BullCharts Tips [/CENTER |
|
|
|
|
Post Reply
|
| Forum Jump | Forum Permissions You cannot post new topics in this forum You cannot reply to topics in this forum You cannot delete your posts in this forum You cannot edit your posts in this forum You cannot create polls in this forum You cannot vote in polls in this forum |


