Stepped price Indicator |
Post Reply 
|
Page <12 |
| Author |
 Printable Version Printable Version Delicious Delicious Digg Digg Facebook Facebook Furl Furl Google Boomarks Google Boomarks Google Buzz Google Buzz MySpace MySpace Newsvine Newsvine reddit reddit StumbleUpon Translate StumbleUpon Translate Twitter Twitter Windows Live Windows Live Yahoo Bookmarks Yahoo Bookmarks Topic Search Topic Search  Topic Options Topic Options
|
RODCAM 
Newbie 
Joined: 15 Nov 2007 Location: Australia Posts: 14 |
 Post Options Post Options
 Quote Reply Quote Reply
 Posted: 03 Apr 2008 at 4:30pm Posted: 03 Apr 2008 at 4:30pm |
|
BD, Thanks, another small incremental change in coding (below) makes it easier to visually pick up break outs, by just delaying the channel one period. I've played around a bit and the indicator is useful for not just break outs but also when prices are range bound. Some interesting results even on a stand alone basis when backtested with Tradesim... [author =Cameron, Rod][target =price]expr:= Expression("Expression",C);a:= input("Step %", 21, 0, 100);b:= a/100; base:= if(hist(expr,1)>=prev(expr)*(1+b), prev(hist(expr,1))*(1+b), if(hist(expr,1)<=prev(expr)*(1-b), prev(hist(expr,1))*(1-b), prev(expr)));upper:= base*(1+b); midup:= base*(1+b*0.618); middn:= base*(1-b*0.618); lower:= base*(1-b); [linestyle =solid; color=blue][name =Upper]upper; [name =Base]base; [name =Lower]lower; [linestyle =dotted; color=red][name =Midup]midup; [name =Middn]middn; [linestyle =fill; color=green][name =Top Fill]upper; base; [color =red][name =Bot Fill]base; lower;
|
|
|
RODCAM - Brisbane
|
|
 |
|
|
cmacdon
BullCharts Guru 
Joined: 09 Sep 2012 Location: Brisbane Posts: 236 |
Post Options
Quote Reply
Posted: 10 Sep 2012 at 9:23pm |
|
Here is a variation that is reasonably good for identifying coloured up and down trends by varying the step function
[target=price; author=Cameron, Rod/BlackDog and
Maximo posts; category=zzz] expr:=
Expression("Expression",C); a:= input("Step
%", 3, 0, 100); b:= a/100; base:=
if(expr>=prev(expr)*(1+b), prev(expr)*(1+b), if(expr<=prev(expr)*(1-b), prev(expr)*(1-b), prev(expr))); [linestyle=dotted] base; upper:=
base*(1+b); upper; upper2:=
base*(1+(b/2)); upper2; Upper3:=
base*(1+(b*3/4)); Upper3; lower:=
base*(1-b); lower; lower2:=
base*(1-(b/2)); lower2; lower3:=
base*(1-(b*3/4)); lower3; [linestyle=fill; color=Red;] upper;
upper2; [color=White] upper2;
base; [color=Yellow] base;
lower2; [color=Blue] Lower2;
lower; [linestyle=pricecolor] [color=Lime Green] Close>base; [color=Red] Close<=base; [color=Blue] true; |
|
|
BC User since June 2007
|
|
|
|
|
cmacdon
BullCharts Guru
Joined: 09 Sep 2012 Location: Brisbane Posts: 236 |
Post Options
Quote Reply
Posted: 16 Dec 2012 at 3:45pm |
|
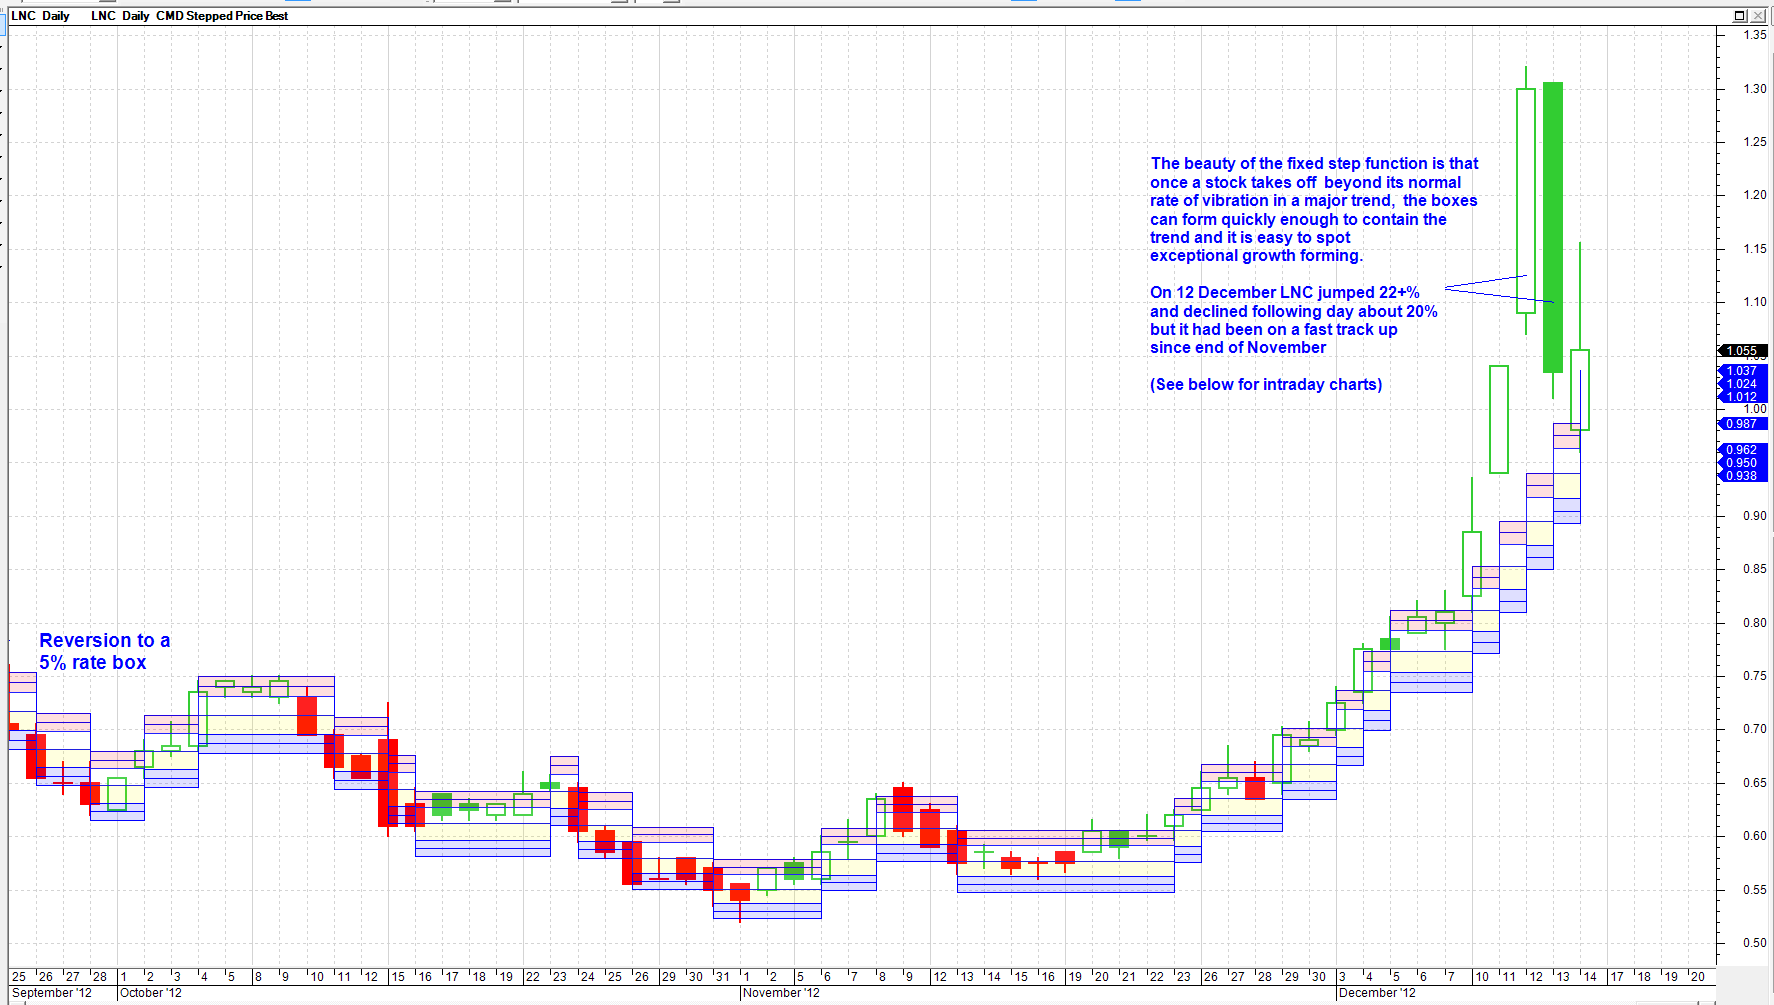
In response to a query by Charlie-B concerning the Joe Ross Concolidation I will post below perhaps a better way to monitor ranges and breakouts and how I use the adapted stepped price inidcator to scan for fast moving stocks on 5 to 15 minuute charts.
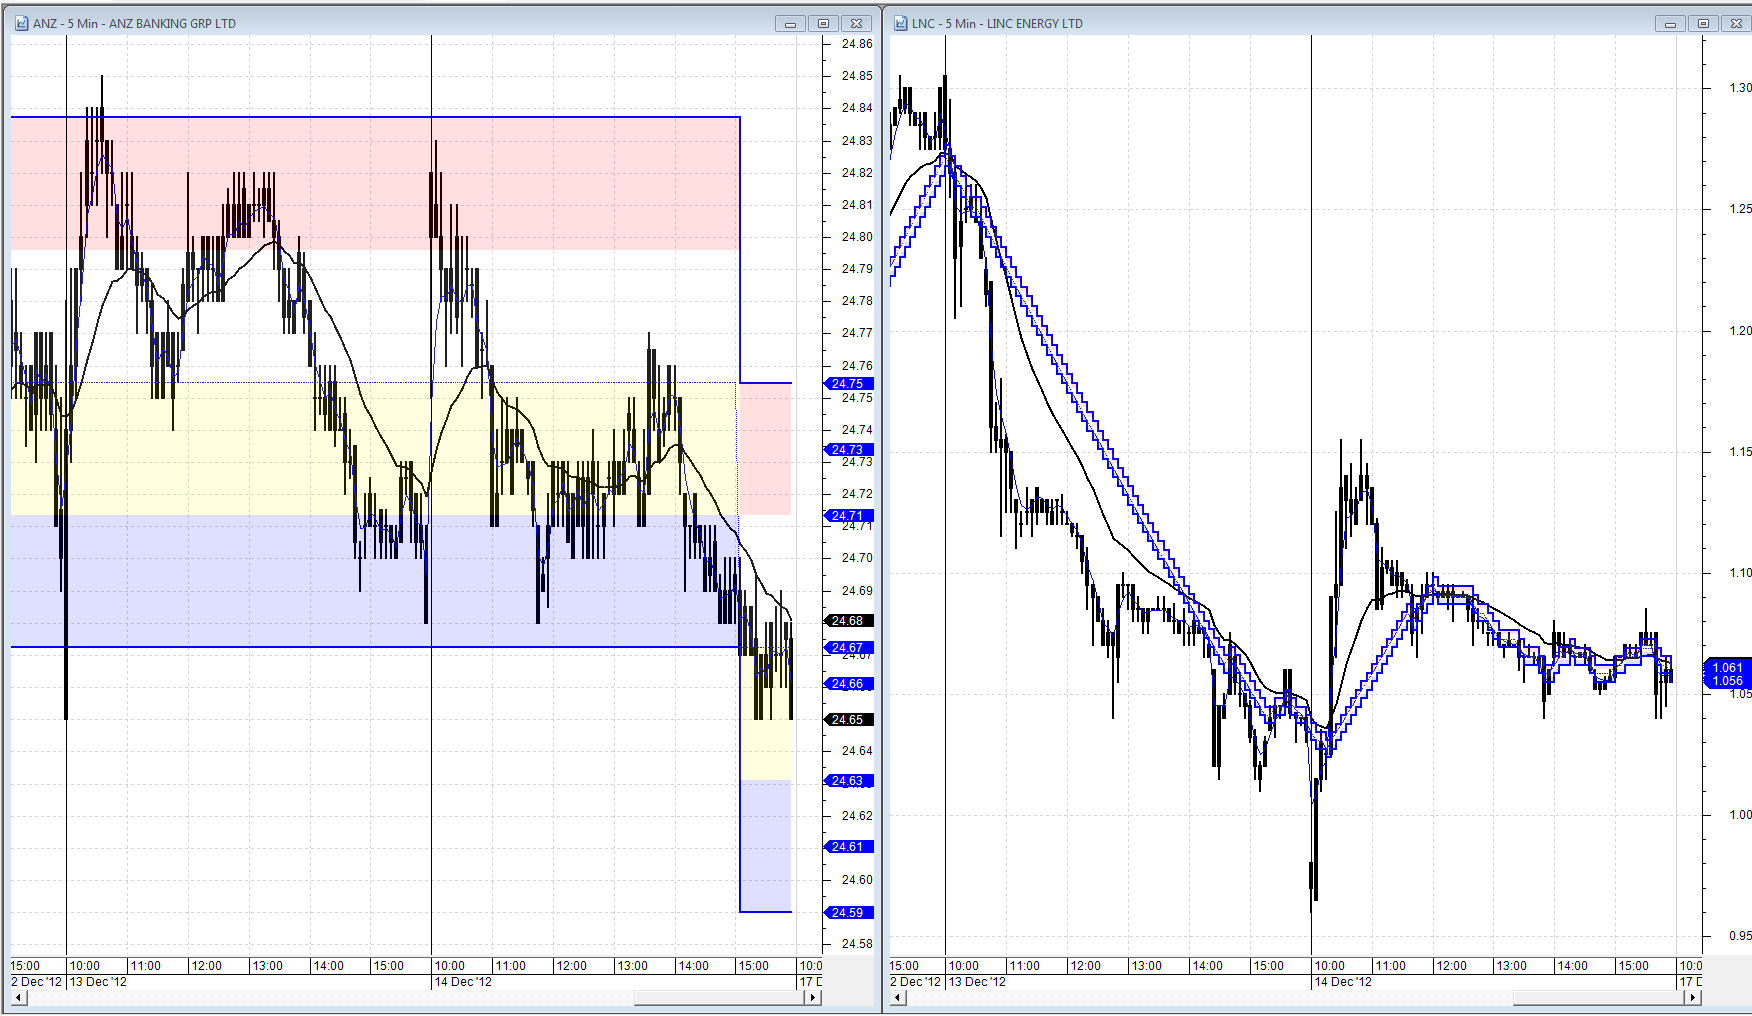
Chart 1 is the daily showing the stepped price indicator with my adapted code previously posted on LNC using 5% boxes. The chart shows trading ranges and colours the bars if they are above or below the mid range of a box. Breakouts are easily seen. Chart 2 shows that if an exception trend occurs the fixed % boxes cannot form quickly enough as they are restricted to say in this case 5% per change and a stock might be tearing away abnormally at a much higher rate e.g LNC over last few days. However they will usually revert to there mean vibration so you can anticipate a change of direction. I code my watchlists into 2% to 8% per day Stepped Price Vibrations and most ASX stocks fit into one of these watchlists very well. Chart 3. Is a 5 Minute chart. So if I want to look at stocks moving at a a rate higher than 2% per day I set the vibration factor at 2%/60 for 5 minute charts as there are a 6 hours perr trading day = 0.0333%. A 15 minute chart scan would be set at 0.8333%. On chart 3 you see side by side a ANZ stock chart moving slowly at less than 2% per day from top of box to mid point, and the normal looking adapted stepped indicator box as a trading range. On the other hand in the right hand box is LNC on similar 5 minute chart but the stepped function is a series of small boxes that cannot contain the price trend. So I can know very early in a 5 or 15 minute chart that a scanned chart is looking like having a very good fast trending day beyond my target rate as distinct from bneing in a more sluggish a ranging day. The other thing you can do with this restriction on the rate at which boxes can form is work out Gann Style squaring of time targets into the future. Or work out rates of growth like Gann angles and if a stock is moving correctly the stepped price lines will form as straight lines at an angle from any point where price and time have come together. |
|
|
BC User since June 2007
|
|
|
|
|
cmacdon
BullCharts Guru
Joined: 09 Sep 2012 Location: Brisbane Posts: 236 |
Post Options
Quote Reply
Posted: 16 Dec 2012 at 3:46pm |

|
|
|
BC User since June 2007
|
|
|
|
|
cmacdon
BullCharts Guru
Joined: 09 Sep 2012 Location: Brisbane Posts: 236 |
Post Options
Quote Reply
Posted: 16 Dec 2012 at 3:47pm |
|
|
|
BC User since June 2007
|
|
|
|
|
cmacdon
BullCharts Guru
Joined: 09 Sep 2012 Location: Brisbane Posts: 236 |
Post Options
Quote Reply
Posted: 16 Dec 2012 at 3:47pm |
|
|
|
BC User since June 2007
|
|
|
|
|
Post Reply
|
Page <12 |
| Forum Jump | Forum Permissions You cannot post new topics in this forum You cannot reply to topics in this forum You cannot delete your posts in this forum You cannot edit your posts in this forum You cannot create polls in this forum You cannot vote in polls in this forum |


