W D Gann's Stock vibrations and market structure |
Post Reply 
|
Page <12 |
| Author |
 Printable Version Printable Version Delicious Delicious Digg Digg Facebook Facebook Furl Furl Google Boomarks Google Boomarks Google Buzz Google Buzz MySpace MySpace Newsvine Newsvine reddit reddit StumbleUpon Translate StumbleUpon Translate Twitter Twitter Windows Live Windows Live Yahoo Bookmarks Yahoo Bookmarks Topic Search Topic Search  Topic Options Topic Options
|
cmacdon 
BullCharts Guru 
Joined: 09 Sep 2012 Location: Brisbane Posts: 236 |
 Post Options Post Options
 Quote Reply Quote Reply
 Posted: 26 Aug 2014 at 6:43pm Posted: 26 Aug 2014 at 6:43pm |
|
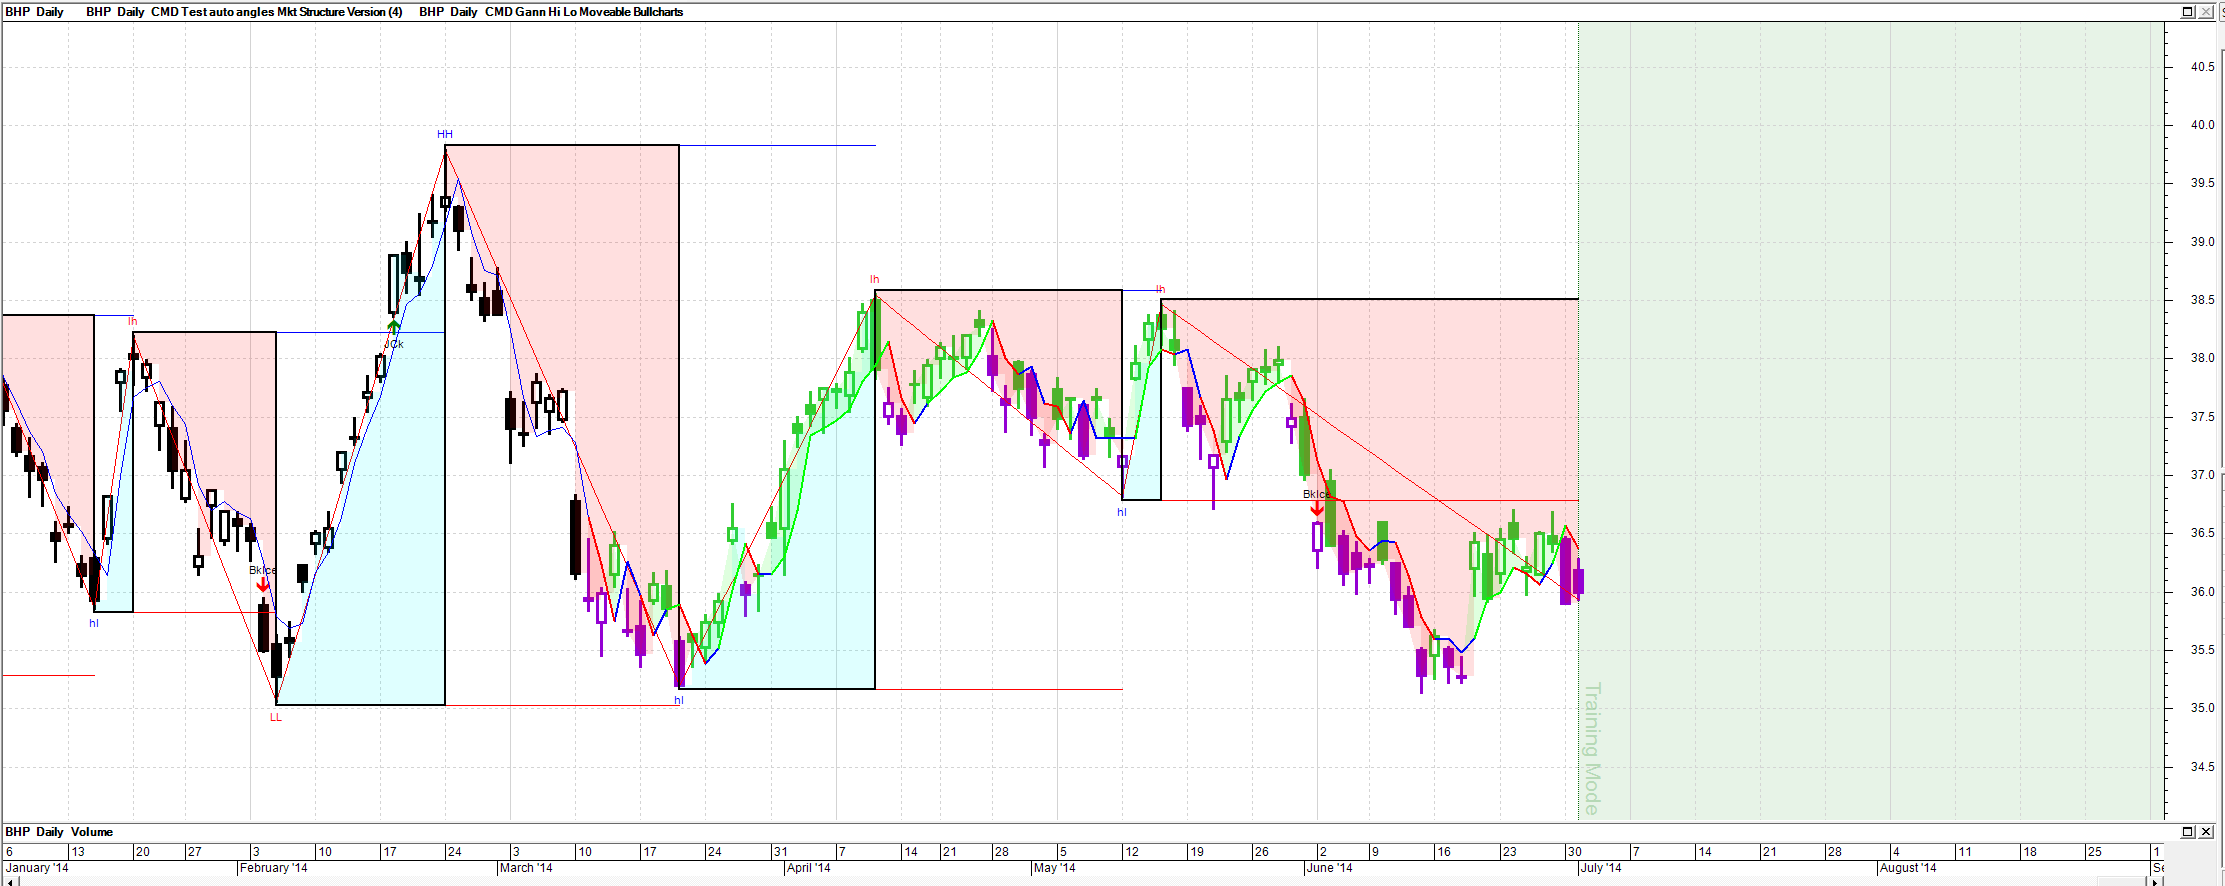
I thought I would point out that the market structure indicator can sometimes redraw. Some indicators e.g zig zag type indicator are quite good when you have very small parameters but when you have big parameter settings there may be a tendency to redraw recent bars due to price action hindsight. (This will be an issue in many cases if you do not understand your indicator so my suggestion might be just do not do scans on an indicator marker if you do not really knowing what the indicator code is doing).
I will show four charts below with the Bullcharts training mode on showing the potential problem, and an additional indicator that somewhat helps to mitigate the problem, as it tends not to redraw. The charts are: a) and b) Close up view of the market structure indicator using 4.44% per previous post. In some swings it captures the turning points quite well and quickly depending upon price action; however, in other cases if there is a bit of congestion around the turning point it might redraw the High or Low point after the event based on a bit of further hindsight from the subsequent price action. c) and d) The addition of another indicator may help reduce the chances of getting caught out if the additional indicator does not tend to redraw and you believe it is reliable for your style of trading. For this purpose, the second indicator I will use below to demonstrate the issue is named the Gann Hi-Lo indicator. I think it came from a conversion from a Metastock indicator I obtained some years ago from Tradersonline website but I did not record the original author, so have a look at the site to give him or her credit. I think the original concept of the Gann HiLo indicator was first coded, I believe by the late Robert Krauz, in his book, W.D. Gann Treasure Discovered based off a previously undiscovered Gann Course Krausz purchased privately. Anyway, I think it is a good indicator, so I provide my converted code below. You can click on the indicator and drag it across a chart in this Bullscript derivation. The additional indicator may help to avoid getting bamboozled by other indicators that redraw, albeit the redrawn other indicators might provide some good statistics of the market structure once a settled version has occurred. The Bullscript code for the Gann Hi Lo indicator is shown further below the charts. 
|
|
|
BC User since June 2007
|
|
 |
|
|
cmacdon
BullCharts Guru
Joined: 09 Sep 2012 Location: Brisbane Posts: 236 |
Post Options
Quote Reply
Posted: 26 Aug 2014 at 6:44pm |
|
Note after the next bar the indicator redraws the last 6 to 8 congested bars and identifies the final trough and change to an uptrend mode but it came after the actual event.
 Edited by cmacdon - 26 Aug 2014 at 6:50pm |
|
|
BC User since June 2007
|
|
|
|
|
cmacdon
BullCharts Guru
Joined: 09 Sep 2012 Location: Brisbane Posts: 236 |
Post Options
Quote Reply
Posted: 26 Aug 2014 at 6:45pm |
|
A way to get around this problem is to use an indicator that does not redraw and which you understand and are comfortable with using. This is the Gann Hi-Lo indicator set to 2 days turning points. I think it is a good indicator. Code is further below.
 Edited by cmacdon - 26 Aug 2014 at 7:02pm |
|
|
BC User since June 2007
|
|
|
|
|
cmacdon
BullCharts Guru
Joined: 09 Sep 2012 Location: Brisbane Posts: 236 |
Post Options
Quote Reply
Posted: 26 Aug 2014 at 6:55pm |
|
{Cmacdon Note: Click on heading or the indicator on chart and black vertical line appears which you should drag across the chart to the bar before the turning point you wish to start from} [Target=Price;] TDate:=InputDate("Date of trend", date(2014,7,10)); HD:=BarsSince(OnOrSkipped(TDate)); pd:=input("Period", 2, 1, 10); HLd:=If(CLOSE>Ref(Ma(H,pd,S),-1), {then}1, {else}If(CLOSE<Ref(Ma(L,pd,S),-1), {then}-1, {else}0)); HLv:=ValueWhen(1,HLd<>0,HLd); HiLo:=If(HLv=-1, {then}Ma(H,pd,S), {else}Ma(L,pd,S)); HiLo; [name=Fill; linestyle=fill;] [color=Lime; ] if(HD,C,undefined); [color=Red; ] if(HD,HiLo,undefined); HiLoTrend:=if(HiLo>=Hist(HiLo,1),1,if(HiLo<Hist(HiLo,1),-1,prev)); [drawundefined=gap] [Linestyle=Solid; Width=2;] [name=HiLo; Color=Blue] pl1a:=if(HD AND HiLoTrend=1 and hist(HiLoTrend,1)=-1,HiLo,if(HD AND HiLoTrend=-1,HiLo,undefined)); pl1a; [Color=Red] pl2a:=if(HD AND HiLoTrend=-1 ,HiLo,if(HD AND hist(HiLoTrend,1)=1,HiLo,undefined)); pl2a; [Color=Lime] pl3a:=if(HD AND HiLoTrend=1 or HiLoTrend=0,HiLo,undefined); pl3a; [linestyle=pricecolor] [color=Lime Green] if(hd and H>=HiLO,1, undefined); [color=Dark Violet] if(hd and L<HiLo,1,undefined); [color=Black] true; |
|
|
BC User since June 2007
|
|
|
|
|
Post Reply
|
Page <12 |
| Forum Jump | Forum Permissions You cannot post new topics in this forum You cannot reply to topics in this forum You cannot delete your posts in this forum You cannot edit your posts in this forum You cannot create polls in this forum You cannot vote in polls in this forum |


