BullCharts Forum Homepage
Forum Home Forum Home > BullCharts > BullScan
  New Posts New Posts RSS Feed: NEW INDICATORS
  FAQ FAQ  Forum Search   Calendar   Register Register  Login Login

NEW INDICATORS

 Post Reply Post Reply
Author
Message / View First Unread Post
Rhubarb View Drop Down
Newbie
Newbie
Avatar

Joined: 11 Sep 2004
Location: Australia
Posts: 10
Post Options Post Options   Quote Rhubarb Quote  Post ReplyReply Direct Link To This Post Topic: NEW INDICATORS
    Posted: 01 Jan 2005 at 11:59am

I guess this is directed to Peter whose help in these matters is invaluable :-

BC provides - under Indicators/Guppy - 2 excellent Indicators called :-

Guppy MMACD-H$

Guppy MMACD-H%

and there is also a Ribbon to complement these indicators which were developed and written by the well known and respected Leon Wilson.

HOWEVER,

these are based on DAILY values and do not reflect what many of us would need for MMA interpretation on Hull style trading.

1. Could we please have these Indicators written with Hulls WEEKLY MMA values...

2. Could these be shown as Histograms - like LW indicated in the Guppy Newsletter of 30.01.04....

3. Could the Scales for these reflect the same sort of values as shown in the article...

4. Could the Ribbon also be available to complement these Indicators...

Many of us will, consequently, be able to build this into our Scans so that the visual part of MMA readings can be assigned to the scrap heap - ie we then have the ability to mechanise the interpretation of the Hull MMAs.

If we think about what this will achieve for us, I am sure it will be regarded as a great step forward

Ric Richardson

Rhubarb 4 All
Back to Top
Seahorse View Drop Down
Regular
Regular
Avatar

Joined: 11 Sep 2004
Location: Australia
Posts: 35
Post Options Post Options   Quote Seahorse Quote  Post ReplyReply Direct Link To This Post Posted: 01 Jan 2005 at 2:14pm

G'day Ric....

In regard to the Hull MMA's, you may find the article posted below of interest......I think it was written by none other than, Alan Hull himself!!

Regards

Seahorse

Using Guppy's MMA's on Weekly Charts

The Guppy MMA's are used for several purposes which include identifying points of market agreement, monitoring established trends and timing market entry by observing short term pullbacks in established trends. I also use the Guppy MMAs on weekly charts to trade Blue Chip shares. Although the Guppy MMA's serve this purpose well, they are tuned for use on daily charts and require 'Tweaking' when applied to weekly charts. What's more it would be narrow minded to assume that one size fits all when different traders and investors are operating in different time frames and using different sets of indicators and methodologies. To adjust the periods of the 12 EMA's, a set of logical rules are required that can be employed by each of us to custom fit the MMA's to our individual purposes.

The first step is to identify your own timeframe…where do you appear on a chart or, more precisely, which EMA best represents your timeframe. Lets assume that you are using the MACD indicator on weekly charts (A use that the MACD was not designed for) and therefore your entry and exits signals are being generated by the 12 week EMA with reference to the 26 week EMA. Your timeframe is best represented by the 12 week EMA. (See Chart-1)

ANZ Bank - 12-Week EMA

That’s me on Chart-1 and I can look at myself and assess whether I am happy with this timeframe. Although the trend started in February 2000 the 12 week EMA didn't turn up, in earnest, until April and this would be about the time that I would consider the trend to be established. At the other end of the trend I can see that the 12 week EMA turns down only when I consider the trend to be in trouble. Note that during the pullbacks in the established period of the trend that the 12 week EMA doesn't reverse and head downwards. Now that I have represented my intentions on the chart using an EMA, I can start to observe the other market participants around me using other exponential moving averages.

The 12 week EMA will become the longest period in the short term group of averages and the shorter periods will show me the behaviour of market participants working in a shorter timeframe than myself. To best represent all of the timeframes in front of me I will spread the values of the short term group from 12 to as close to 1 as I can with even spacing. These values are 2, 4, 6, 8, 10 & 12. Chart-2 shows the resulting short term group of EMA's. (Price bars-Off)

ANZ Bank - Short term EMA's

I can differentiate between the pullbacks and a trend reversal using the short term group of averages shown in Chart-2. Identifying pullbacks gives me the ability to fine tune entries into existing trends as well as monitor open positions. Note that the short term group are indicating a period of market agreement just prior to April. This is the point at which I said that I was happy to enter the market because the trend had become established.

Step 2 is to select the shortest period in the long term group of averages. It is the width of the gap between the 2 groups of averages that is of importance and this will be decided by the value I assign to the first EMA in the long term group. A compression in the short term group is telling us that the market participants in front of us have broken ranks and that the trend is now relying on support from longer term market participants such as ourselves. A collapse of the gap separating us from the longer term market participants signals a collapse of support by the market participants who are working in the same timeframe as us and just beyond. When our fellows break ranks it is a good idea for us to take our leave with them. Hence, the gap is a safety cushion that is representative of our tolerance towards the trend. If a pullback occurs and there is compression in the short term group then I will immediately start monitoring the gap for any sign of collapse. A collapse in the gap will confirm an exit signal from the MACD. Although the gap can be tuned through trial and error, I have found that the Fibonacci ratio of 1.618 can be used as a universal multiplier to set the shortest value of the long term group.

This is achieved by multiplying the longest period in the short term group (12 in our case) by 1.618 and rounding the answer to the nearest whole number (ie. 19.416 round to 19). I then set the remaining 5 values so that the spacing between these lines visually matches the spacing between the short term group. I find that incrementing with 3, 4 or 5 usually achieves the desired result. In Chart-3 I have used an increment of 3 which gives 19, 22, 25, 28, 31 & 34.

ANZ Bank - MACD

The long term group of averages are indicative of the overall trend. The gap between the 2 groups of averages provides confirmation of the final MACD exit signal whilst invalidating earlier MACD exit signals. The downturn in the long term group adds further weight to this exit. The long term group of averages also support the point of agreement signaled in March by the short term group. Note how the MACD gave an entry signal in March but the MMA's didn't confirm the trend until April. This universal approach to custom fitting the Guppy MMA's allows anyone, whether Trader or Investor, to use this indicator on weekly or even monthly charts providing they can answer one question…which moving average best represents me?


Edited by Seahorse
My Reality Check bounced
Back to Top
Seahorse View Drop Down
Regular
Regular
Avatar

Joined: 11 Sep 2004
Location: Australia
Posts: 35
Post Options Post Options   Quote Seahorse Quote  Post ReplyReply Direct Link To This Post Posted: 01 Jan 2005 at 2:31pm

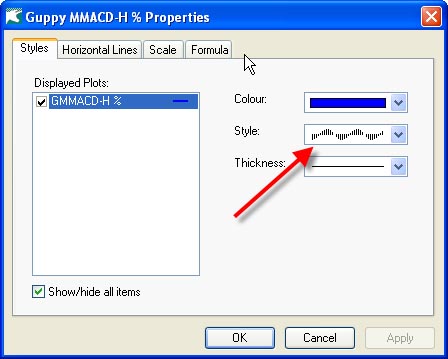
G'day Again...

In response to your second question

"2. Could these be shown as Histograms - like LW indicated in the Guppy Newsletter of 30.01.04...."

You should be able to display this indicator as a Histogram by simply altering the "style"

Regards

Seahorse

My Reality Check bounced
Back to Top
 Post Reply Post Reply

Forum Jump Forum Permissions View Drop Down

Bulletin Board Software by Web Wiz Forums® version 9.69
Copyright ©2001-2010 Web Wiz