Natural Support and resistance based on Volume |
Post Reply 
|
| Author |
 Printable Version Printable Version Delicious Delicious Digg Digg Facebook Facebook Furl Furl Google Boomarks Google Boomarks Google Buzz Google Buzz MySpace MySpace Newsvine Newsvine reddit reddit StumbleUpon Translate StumbleUpon Translate Twitter Twitter Windows Live Windows Live Yahoo Bookmarks Yahoo Bookmarks Topic Search Topic Search  Topic Options Topic Options
|
cmacdon 
BullCharts Guru 
Joined: 09 Sep 2012 Location: Brisbane Posts: 236 |
 Post Options Post Options
 Quote Reply Quote Reply
 Topic: Natural Support and resistance based on Volume Topic: Natural Support and resistance based on VolumePosted: 08 Dec 2012 at 6:55pm |
|
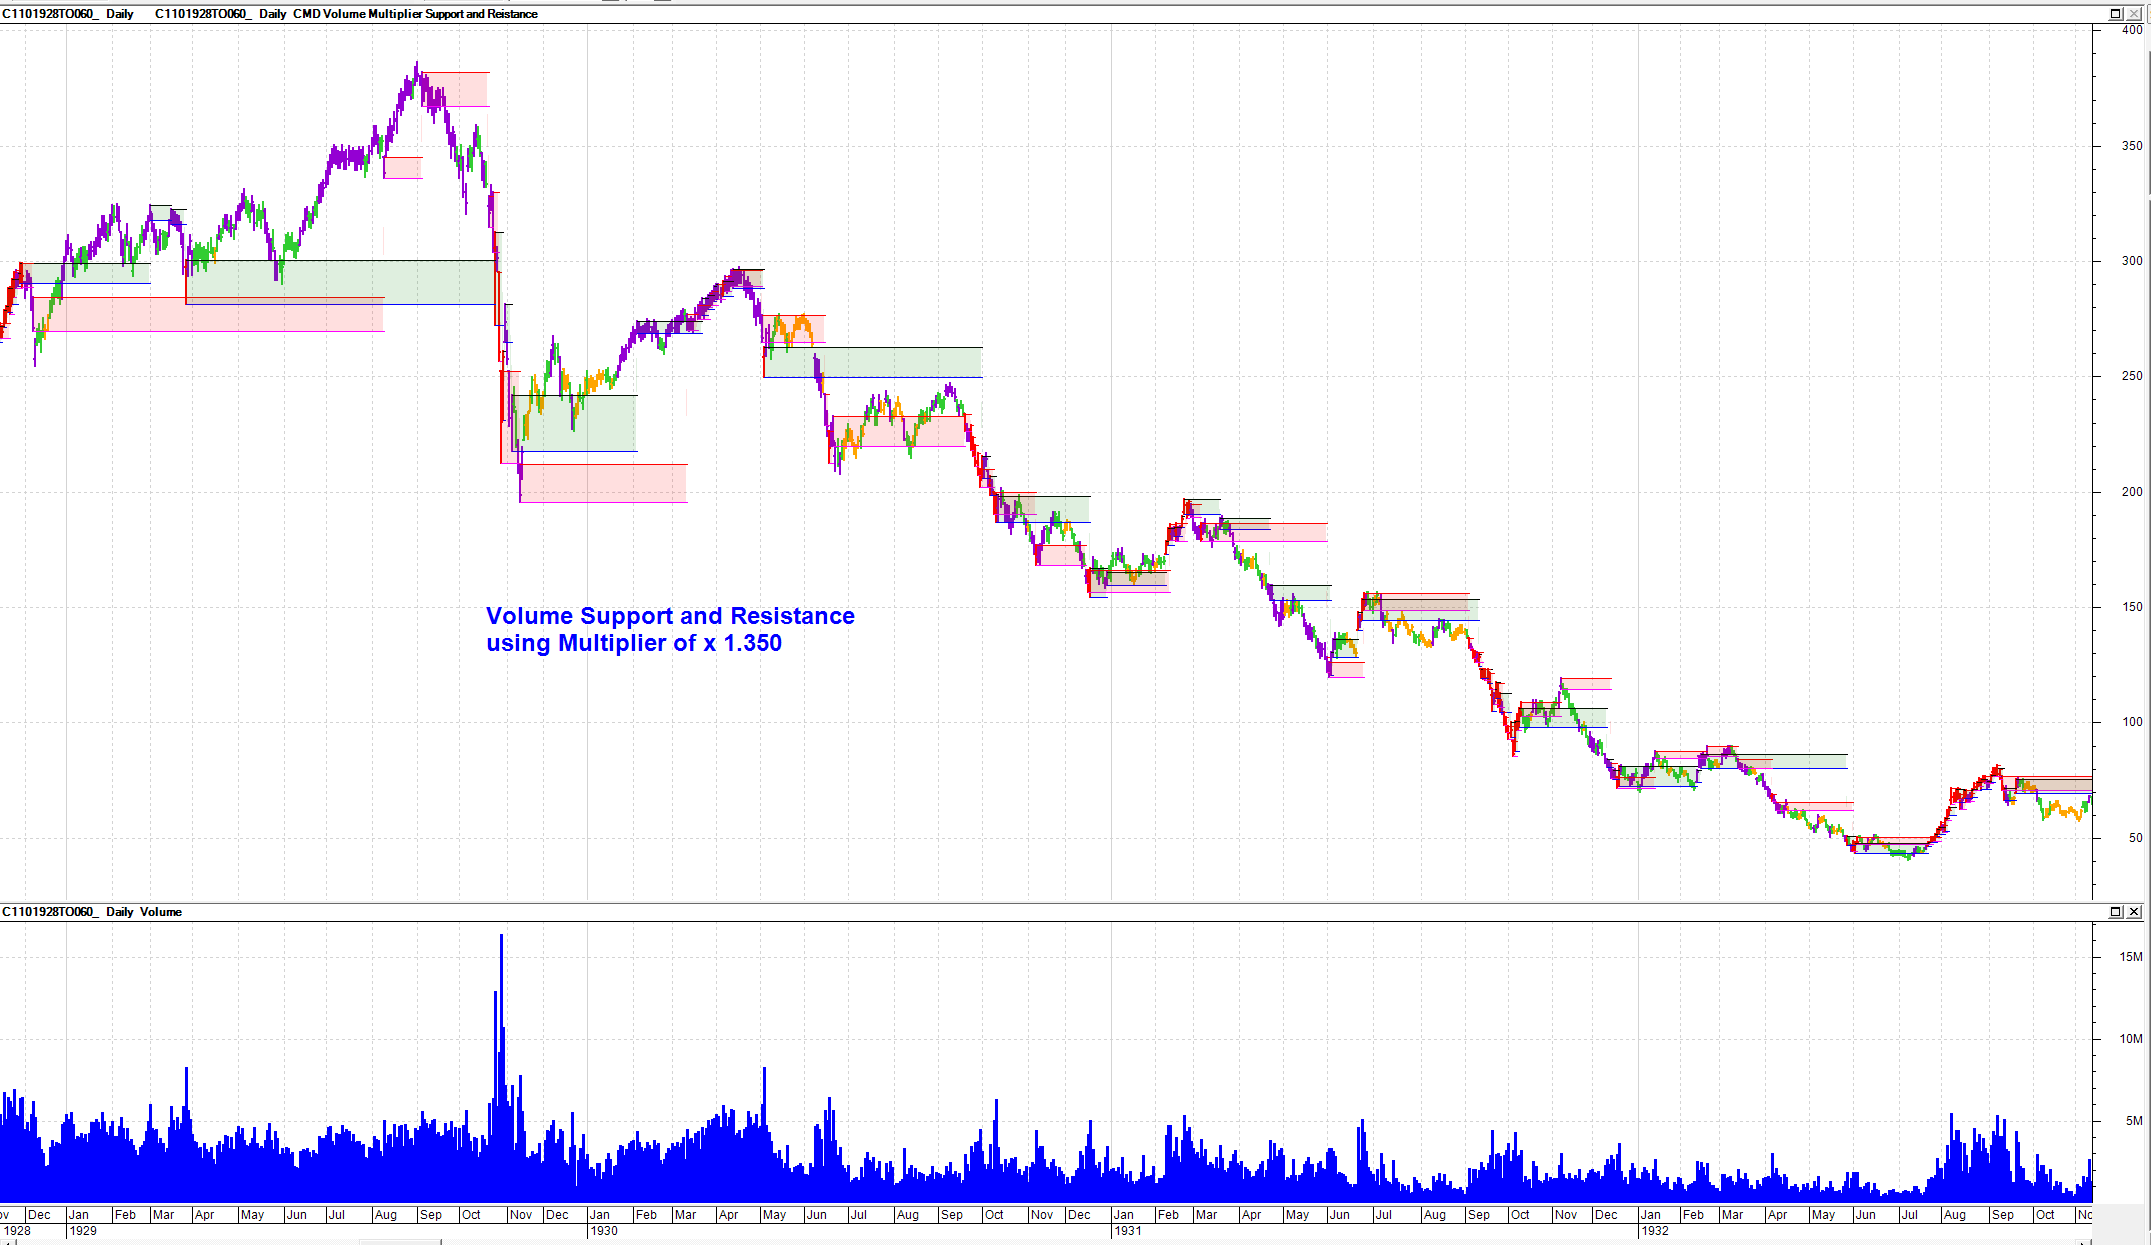
Here is a new indicator to estimate the natural support and resistance levels that may help in forecasting a change in direction for a stock or index. I will put some charts further below so you can get the drift of how you might apply the indicator to either a stock or index or an intraday chart.
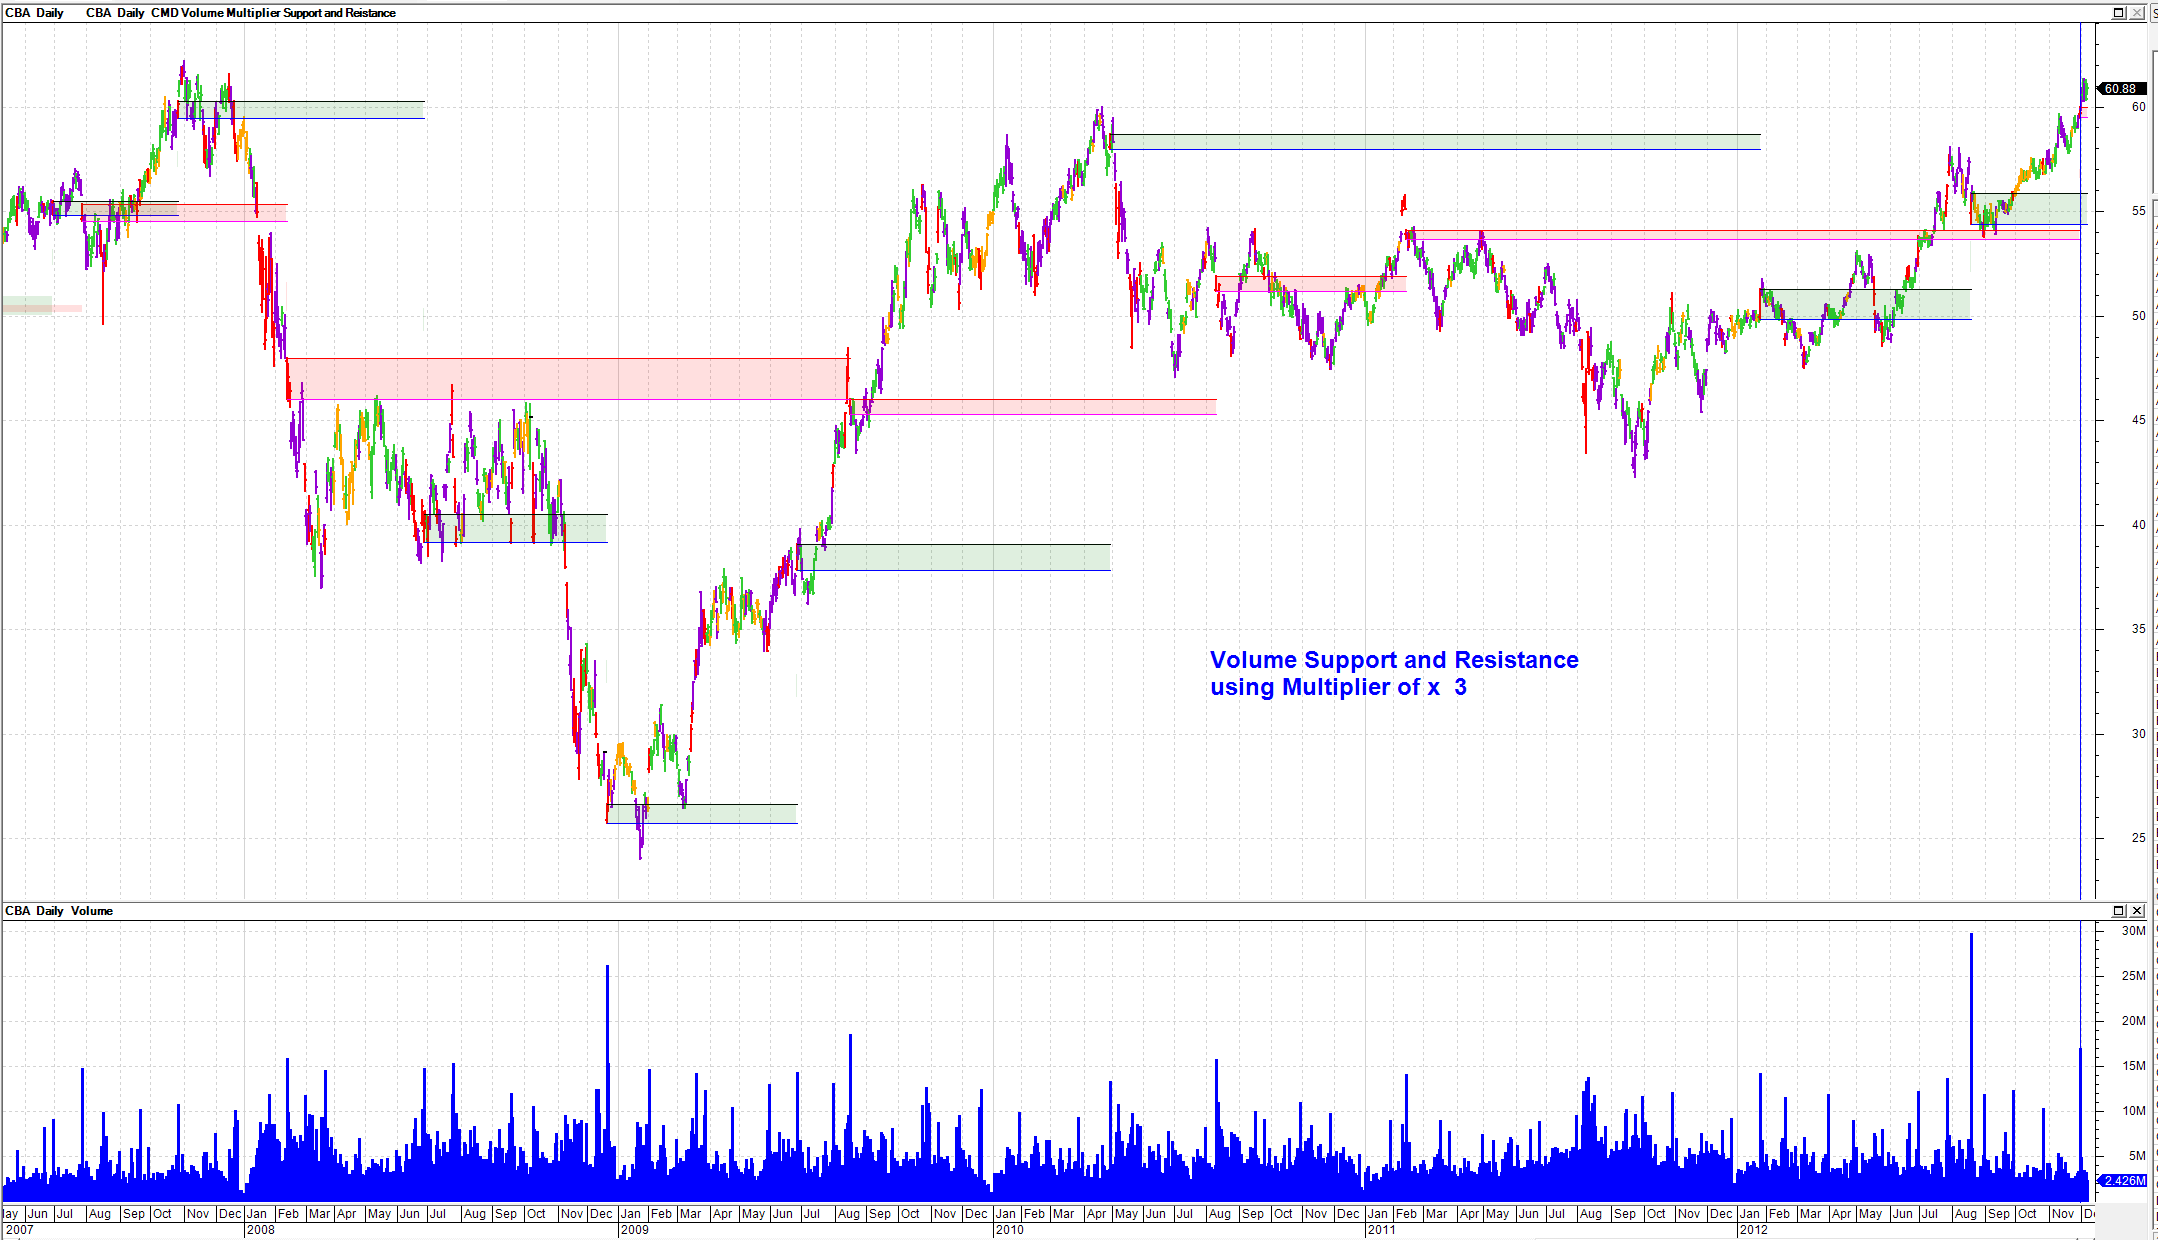
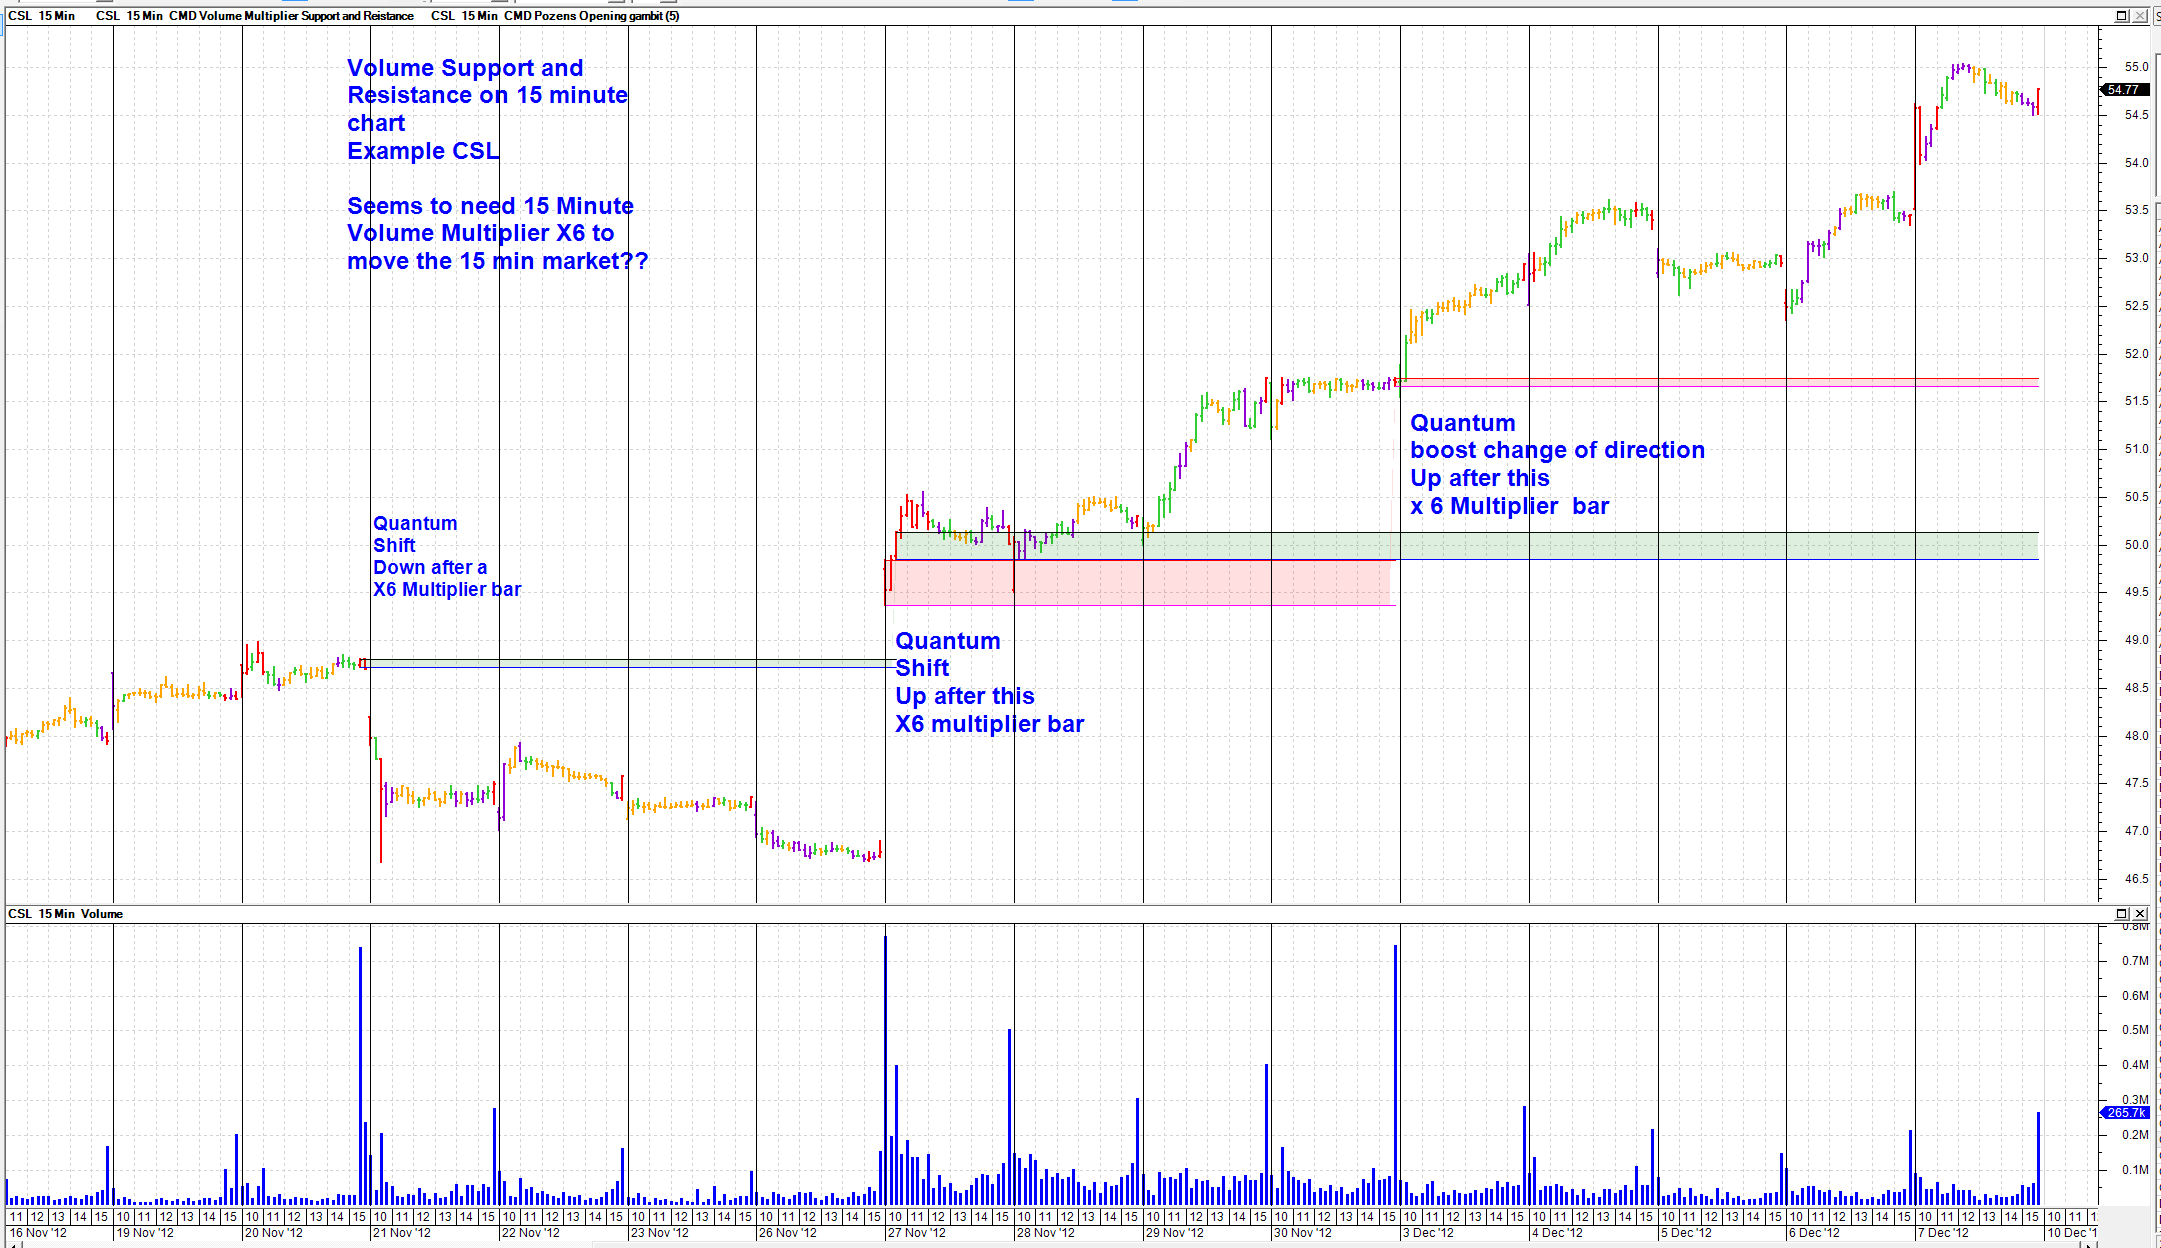
Many support and resistance indicators are based on picking peaks and troughs in prices over the "x" number of days to suggest that the indicator shows an appropriate support or resistance level. The trouble I have always had with these indicatoprs is that if I superimpose the indicators on top of one another they do not agree with each other so I am left with the conundrum - which one is more right? and basically, it gets down to the assumptions made by the indicator writer when writing their code. Maybe a better way, going back to my VSA routes is to introduce volume. Volume is activity (where some Smart Money players have put their, or more likely their clients,' money, on the line to change the direction of the market). Volume is usually a fact of life albeit it may differwhewn reported from different data vendors but if you trust your data vendor then go with it. I have developed the following indicator (and show the Bullcharts code further below which is based on volume to identify the more naturally occurring support and resistance levels. For my own internal consistency, some of the parameters I used in deverloping the indicator are the same as the parameters I used in my VSA indicator code inputs but you are free to do what ever you want with the indicator code and parameters. What I am really trying to identify is what Volume multiplier times the moving average of volume brings about change of direction in a particular index or stock based on the timeframes likely to be traded. Once you have the indicator in Bullcharts then change the multiiplier up and down to finds what you think is the key level for your index or stock. It is always useful to tell a story so I will show Bullcharts chart below for the following 1. DJIA daily index 1929 crash and aftermath based on charts with diffent Volume indicator multiplers 2 More recent GFC Crash and aftermath todfate for CBA Bank daily bar chart 3. 15 minute chart CSL I wil post charts separately |
|
|
BC User since June 2007
|
|
 |
|
|
cmacdon
BullCharts Guru
Joined: 09 Sep 2012 Location: Brisbane Posts: 236 |
Post Options
Quote Reply
Posted: 08 Dec 2012 at 7:26pm |
|
|
|
BC User since June 2007
|
|
|
|
|
cmacdon
BullCharts Guru
Joined: 09 Sep 2012 Location: Brisbane Posts: 236 |
Post Options
Quote Reply
Posted: 08 Dec 2012 at 7:46pm |
|
|
|
|
BC User since June 2007
|
|
|
|
|
cmacdon
BullCharts Guru
Joined: 09 Sep 2012 Location: Brisbane Posts: 236 |
Post Options
Quote Reply
Posted: 08 Dec 2012 at 7:52pm |
|
I keep losing these attempted postings
Compare the above Support and resistance levels with a multiplier of 1.35 to to a Multiplier of 2 X the moving averqage. The higher number shows stronger support and resistance levels. The way to trade might be to consider taking a trade or staying in one in the direction of the bars after a very large volume day occurs. The fills are colour coded for Bullish or Bearish closes on the particular very high Volume day but this may ponly be indicative of subnsequent direction. The bars following the very high volume day shown the best direction until the subsequent very high volume day occurs. 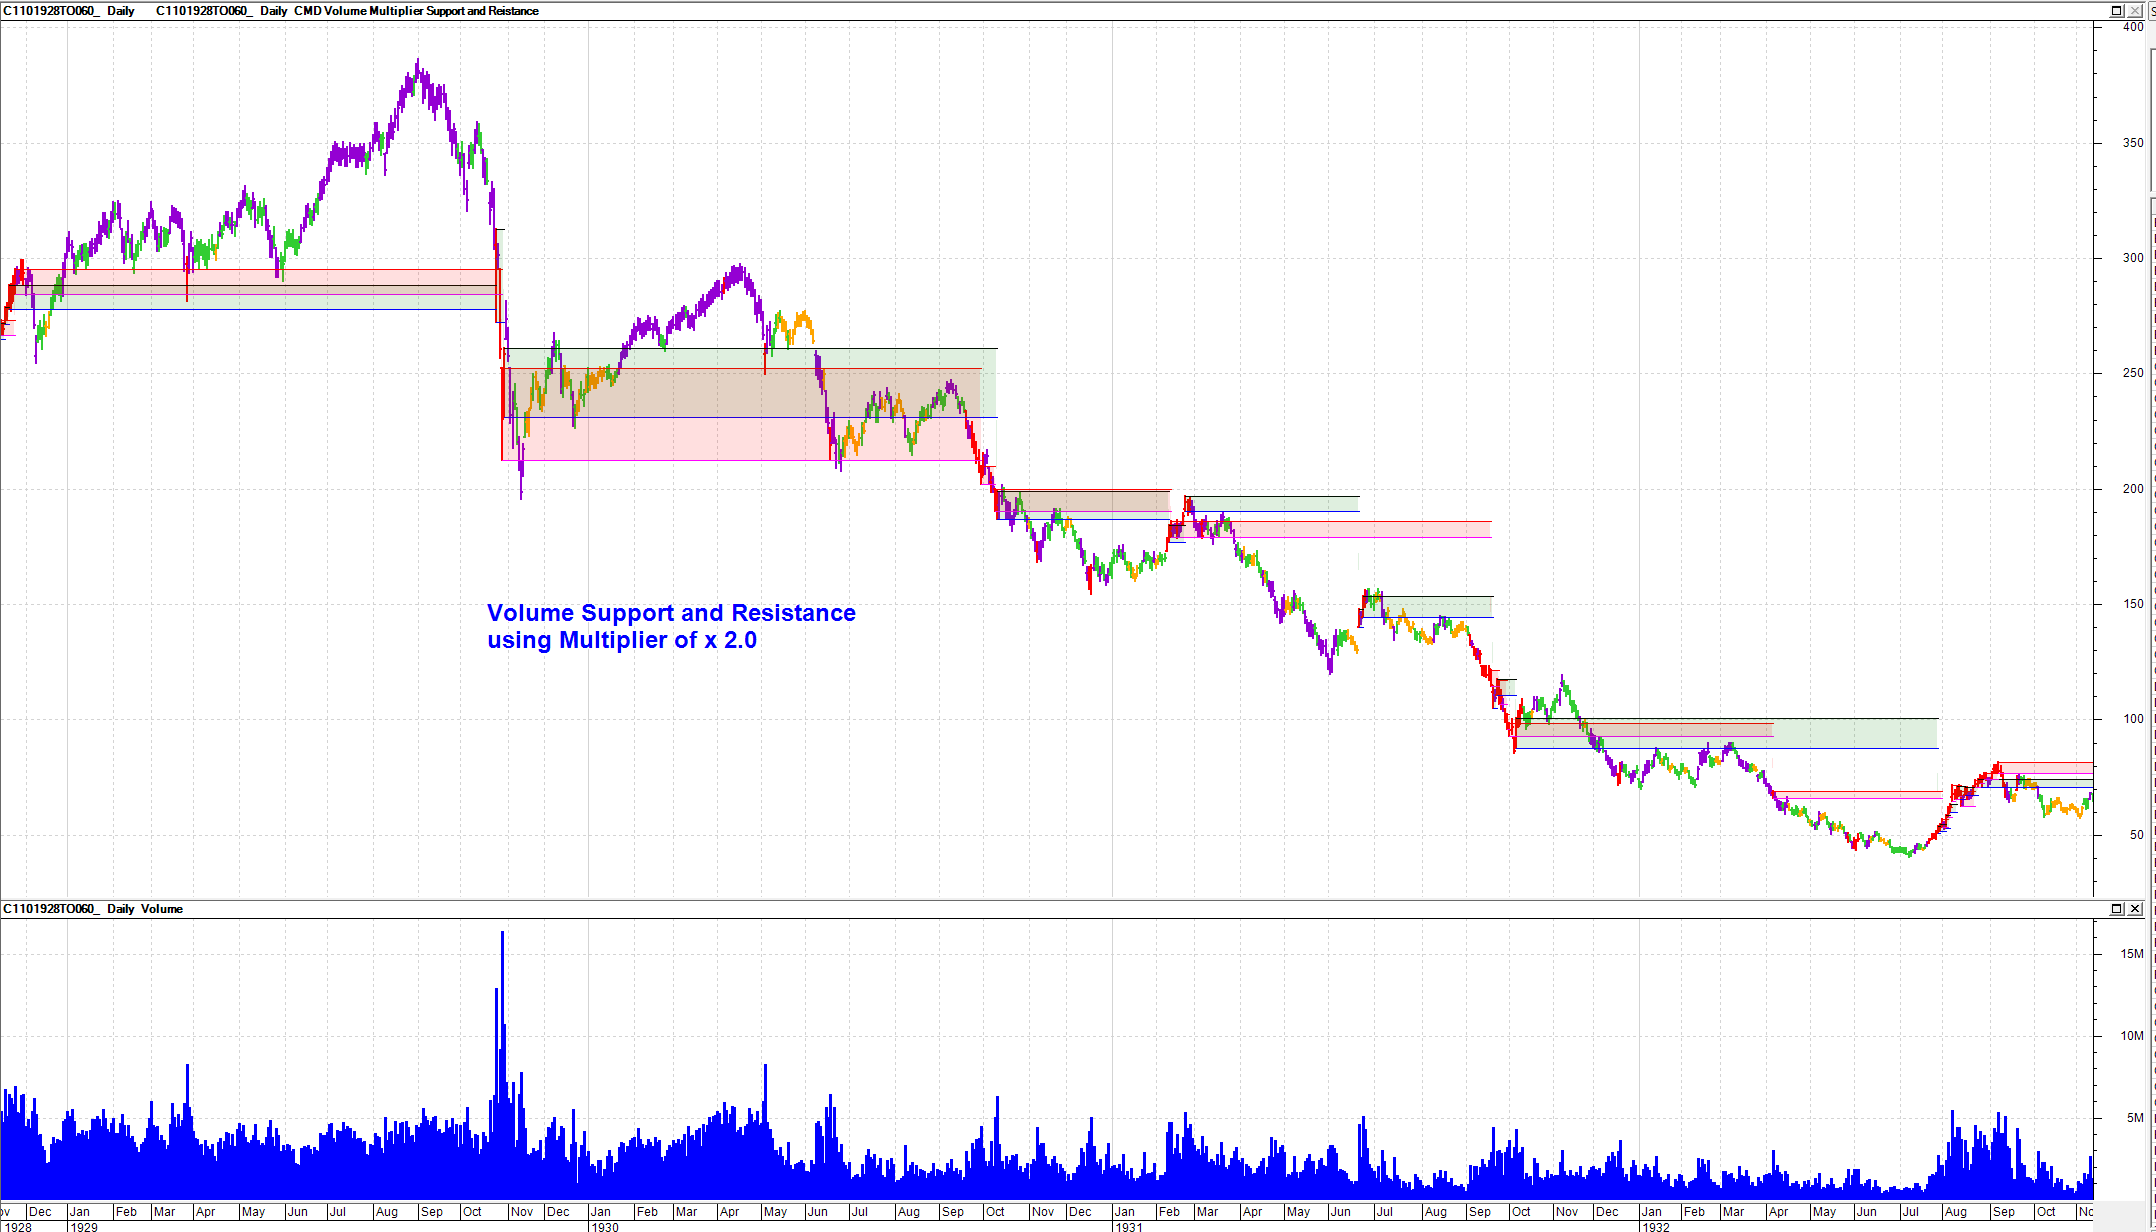 |
|
|
BC User since June 2007
|
|
|
|
|
cmacdon
BullCharts Guru
Joined: 09 Sep 2012 Location: Brisbane Posts: 236 |
Post Options
Quote Reply
Posted: 08 Dec 2012 at 7:53pm |
|
|
|
BC User since June 2007
|
|
|
|
|
cmacdon
BullCharts Guru
Joined: 09 Sep 2012 Location: Brisbane Posts: 236 |
Post Options
Quote Reply
Posted: 08 Dec 2012 at 7:54pm |
|
|
|
BC User since June 2007
|
|
|
|
|
cmacdon
BullCharts Guru
Joined: 09 Sep 2012 Location: Brisbane Posts: 236 |
Post Options
Quote Reply
Posted: 08 Dec 2012 at 7:57pm |
|
Here is indicator code
{This is the key Multiplier to identify the abnormal Volume days used to identify the natural support and resistance levels} Mult:= input("Multiplier for large Vol", 3.00, 0.5, 10);
{Hereafter Uses some of the same parameters as CMD VSA indicator code so as to be internally consistant with that approach. Otherwise this can still be used as standalone indicator} prd1:= input("Period for Volume MA", 50, 1, 200); prd2:= input("Period for Total Spread MA", 200, 1, 200); Cut:= input("Narrow Spread Cut off", 0.65, .05, 0.8); Cut2:= input("UltraWS Cut off", 1.3, .05, 2.0); method := inputma("Method",SIMPLE); THExLo:= input("Extreme Low Vol Maximum Threshold", 0.60, .1, 2); THLo:= input("Maximum for Low Vol Threshold", 0.9, .1, 2); THNo:= input("Ultra High Minimum Vol Threshold", 1.5, .1, 2.00); Uf:= input("Upthrust % on previous High", 1.0005, .05, 2.0); Tf:= input("Test decline factor", 0.9995, .05, 2.0); Range := H - L; ELV:= If(V<=THExLo*ma(V,prd1,s),V,0); LV:= If(V>THExLo* ma(V,prd1,s) and V<=THLo*ma(V,prd1,s), V, 0); HV:= If(V>THLo* ma(V,prd1,s) and V<=THNo*ma(V,prd1,s), V,0) ; UHV:= If(V>THNo*ma(V,prd1,s),V,0); Upbar:= C>Hist(C,1); Levelbar:= Hist(C,1); {used for TW Easy Trend rules} Downbar:= C< Hist (C,1); NS:=(Range<=Cut* ma(Range,prd2,method)); WS:=(Range>Cut* ma(Range,prd2,method) ) and (Range<Cut2* ma(Range,prd2,method)); UltraWS:=(Range>=Cut2* ma(Range,prd2,method) ); UltraBear:= C<=((Range*0.2)+L); Bear:= C>((Range*0.2)+L) AND C<((Range*0.50)+L); Bull:= C>=((Range*0.50)+L) AND C<((Range*0.80)+L); UltraBull:= C>=((Range*0.80)+L);
{-------------------------------------------------------------------------------------------------------}
{This puts on Horizontal lines on high and low of very High Vol Bars based on the Multiplier used} { Very Large Volume } [name =VLVH; linestyle=Horz Step; color=Black; width=1] VLVH:= If((V>=Mult*ma(V,prd1,s)) and (Bull or UltraBull),H ,Undefined); VLVH; [name =VLVL; linestyle=Horz Step; color=Blue; width=1] VLVL:= If((V>=Mult*ma(V,prd1,s)) and (Bull or UltraBull),L ,Undefined); VLVL; [name =VLVL; linestyle=Horz Step; color=Red; width=1] VLVH2:= If((V>=Mult*ma(V,prd1,s)) and (Bear or UltraBear),H ,Undefined); VLVH2; [name =VLVL; linestyle=Horz Step; color=Magenta; width=1] VLVL2:= If((V>=Mult*ma(V,prd1,s)) and (Bear or UltraBear),L ,Undefined); VLVL2; [Visible =True;] { Infill colour on Support and Resistance levels Green= Very High Vol and closed Bullish Red is for Bearish Close} [name =Very Large Vol and Bullish; linestyle=fill] [color =Green] Valuewhen(1,VLVH,H); [color =Green] Valuewhen(1,VLVL,L); [name =Very Large Vol and Bearish; linestyle=fill] [color =Red] Valuewhen(1,VLVH2,H); [color =Red] Valuewhen(1,VLVL2,L);
{-----------------------------------------------------------------} {Colours bars for amount of Volume} [target =Price; linestyle=PriceColor]
[name =Extreme Low Vol;Color=Orange] {Extremely Low Volume} If ( ELV,V,0); [name =Low Vol;Color=Lime Green] { Low volume} If ( LV, V, 0); [name =High Vol;Color=Dark Violet] { High Volume climax} If (HV, V,0) ; [name =Ultra High Vol;Color=Red] { Ultra High Volume} If (V>THNo*ma(V,prd1,s),Min(V, Mult*ma(V,prd1,s)) ,0); [name =Maxed Out Ultra High Vol;Width=6; Color=Black] { Ultra High Volume} If ( V >=Mult*ma(V,prd1,s),Min(V, Mult*ma(V,prd1,s)) ,0); |
|
|
BC User since June 2007
|
|
|
|
|
Post Reply
|
| Forum Jump | Forum Permissions You cannot post new topics in this forum You cannot reply to topics in this forum You cannot delete your posts in this forum You cannot edit your posts in this forum You cannot create polls in this forum You cannot vote in polls in this forum |


