DTOSC & RSI/ Swami charts |
Post Reply 
|
| Author |
 Printable Version Printable Version Delicious Delicious Digg Digg Facebook Facebook Furl Furl Google Boomarks Google Boomarks Google Buzz Google Buzz MySpace MySpace Newsvine Newsvine reddit reddit StumbleUpon Translate StumbleUpon Translate Twitter Twitter Windows Live Windows Live Yahoo Bookmarks Yahoo Bookmarks Topic Search Topic Search  Topic Options Topic Options
|
cmacdon 
BullCharts Guru 
Joined: 09 Sep 2012 Location: Brisbane Posts: 236 |
 Post Options Post Options
 Quote Reply Quote Reply
 Topic: DTOSC & RSI/ Swami charts Topic: DTOSC & RSI/ Swami chartsPosted: 20 Sep 2012 at 9:10pm |
|
Jazza
This is probably a new topic. At end of last post regarding Heikin Ashi you mentioned you use 7 period RSI. Here is an indicator you might want to play around with . It is DTOSC with RSI. DTOSC is a Stochastic variation. I found the code some years ago on a Spanish site in a mixture of Metastock /Spanish description languages. I translated it ( i think accurately) and added the Bullcharts Fill colours but the code is what it is. I do not use it as I do not use RSI. You may have a use for it. I originally wanted code for DTOSC as Robert MIner uses DTOSC( I think Robert Miner was the author of the DTOSC indicator) all the time in his book High Probability Trading strategies, Wiley Books, 2009 and I wanted to see what it does. (Aside:Interestingl;y, in a recent Article in TASC magazine John Ehlers suggests Stochastics and RSI often may not give give similar signals although they should do, and shows that his his Swami charts method helps to produce similar signals from "Swami" stochastics and RSI). I understand Metastock language cannot handle the loops needed in Swami charts and therefore I assume Bull script cannot produce Swami charts. IF any one knows hopw to adapt BUllScript to produce Swami Charts I would appreciate it as I use Swami Stochastics on another programe and it is really good). Anyway here is the DTOSC and RSI code.
expr := expression("Expression"); periods := input("Time periods",14,1); DiasSto:= input("Stoch periods", 13, 2, 100); MA1:= input("MA1 Length", 8, 2, 100); MA2:= input("MA2 Length", 8, 2, 100);
U := ma(max(expr - hist(expr,1),0),periods,WILDERS); D := ma(max(hist(expr,1) - expr,0),periods,WILDERS); res := 100 - (100/(1 + U/D));
STRSI:= ((100 - (100/(1 + U/D))- LLV( 100 - (100/(1 + U/D)),DiasSto)) / ( HHV(100 - (100/(1 + U/D)),DiasSto) - LLV(100 - (100/(1 + U/D)),DiasSto) ))*100 ; Sig1:= ma(STRSI,MA1,S); Sig2:= ma(Sig1,MA2,S); [name =RSI] res; [name =DTOSC1] Sig1; [name =DTOSC2] Sig2; { Fill } [name =Fill; linestyle=fill; visible=false] [color =green] Sig1; [color =red] Sig2; [name =Cross; linestyle=marker; marker=type1; visible=no] [tooltip="DTOSC Signals Cross"] cross (Sig1,Sig2) or cross (Sig2,Sig1); { Markers } [name =Dtosccross; linestyle=marker; marker=type1; tooltip="Dtosc"] cross (sig1,sig2); [name =Dtosc1cross; linestyle=marker; marker=type2; tooltip="Dtosc1"] cross (sig2,sig1) |
|
|
BC User since June 2007
|
|
 |
|
|
cmacdon
BullCharts Guru
Joined: 09 Sep 2012 Location: Brisbane Posts: 236 |
Post Options
Quote Reply
Posted: 13 Oct 2012 at 4:09pm |
|
In his
article Introducing Swami charts in the March 2012 Edition of Technical
Analysis of Stocks and Commodities, John Ehlers provided Easy Language code for
Swami Stochastics. Further to
the above post regarding Swami charts, I could not convert that code and the
Heat Map into Bullscript. However, I
adapted some clever code by Peter in a “Fun with Bullscript “ post from 22 Oct
2004 to adapt Lanes Stochastic Oscillator provided by Bullcharts to produce a
range of charted value for the
Stochastic. A benefit of using same,
maybe showing the results of a range of inputs for %K shows the longer term stochastic as well as the
short term which may help a user avoid some usually occurring Stochastic whipsaw
signals. Anyway, something else to play
around with if you choose to do so. In
the chart below I show the normal Stochastic indicator and signals on default
settings, in the middle is the adapted coding for a range of stochastic results
with original post “Fun with Bullscript” colour scheme. The third indicator is just changing the
settings and also the colours in the styles menu. 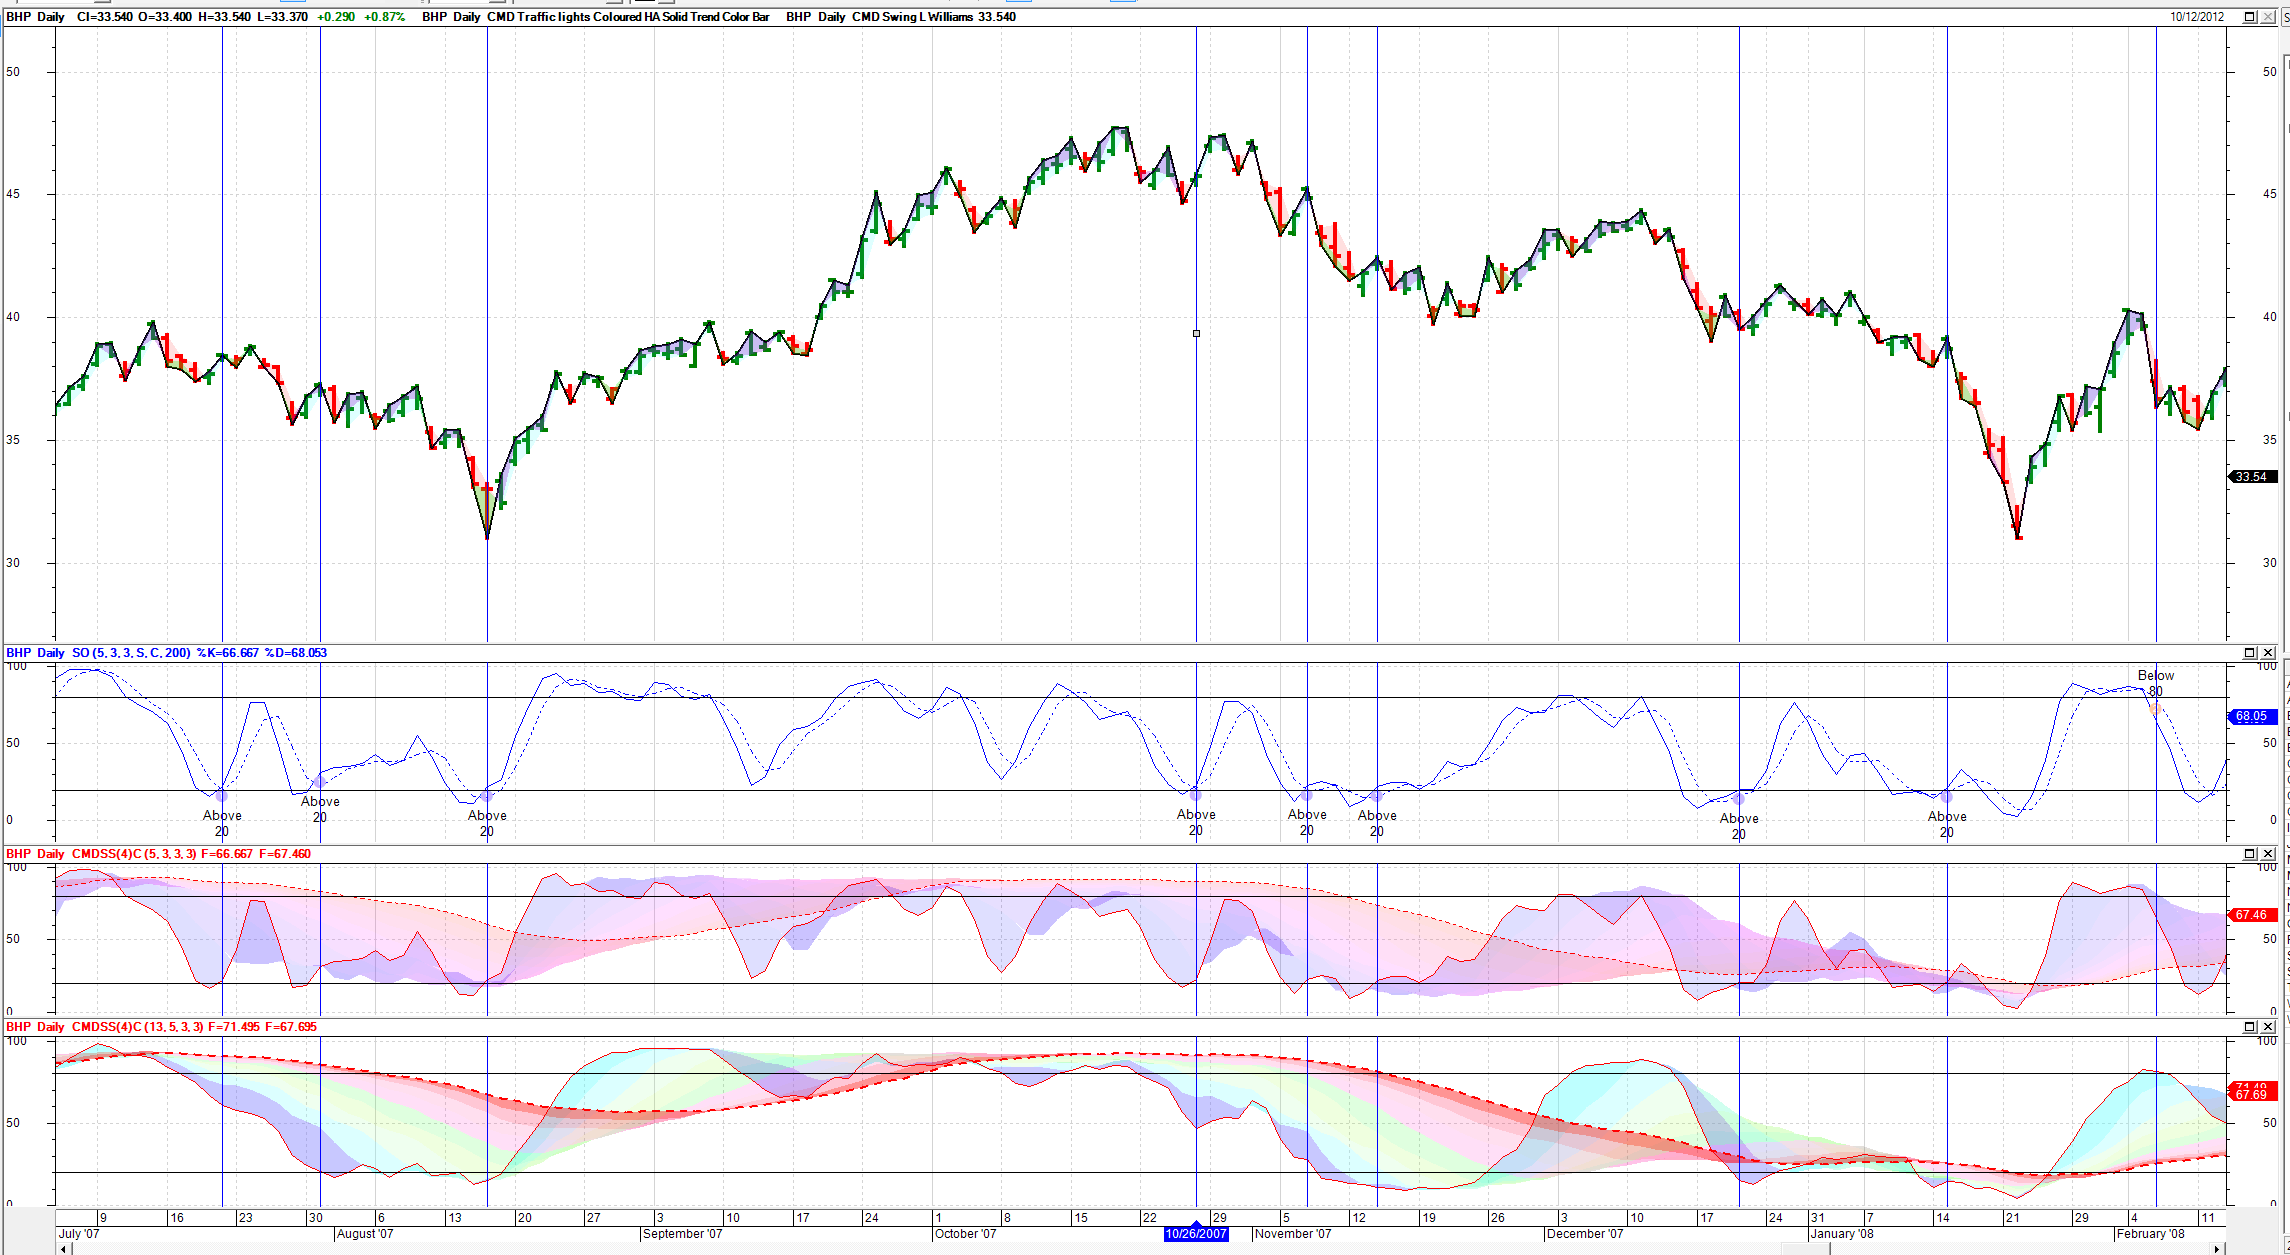
|
|
|
BC User since June 2007
|
|
|
|
|
cmacdon
BullCharts Guru
Joined: 09 Sep 2012 Location: Brisbane Posts: 236 |
Post Options
Quote Reply
Posted: 13 Oct 2012 at 4:11pm |
|
[description ="Stochastic coloured range"] [citation ="''Lane's Stochastics'' by George C. Lane, M.D.Stocks & Commodities March 1994 www.traders.com. Also adapted "Peter, Bullcharts Staff, coded from "Fun with Bullscript, post 22 Oct 2004" ] [target =Percent; category=Oscillators; alias=Stoch4] [horzlines =80,20] kp := input("%K Time periods",8,1); kslowing := input("%K Slowing periods",3,1); dperiods := input("%D Time periods",3,1);
[name =%K] kay := ( sum(C - llv(L,kp),kslowing) / sum(hhv(H,kp) - llv(L,kp),kslowing)) * 100;
st := input("Step size", 3,1); res1 := ( sum(C - llv(L,kp),kslowing) / sum(hhv(H,kp) - llv(L,kp),kslowing)) * 100; res2 := ( sum(C - llv(L,kp+st),kslowing+st) / sum(hhv(H,kp+st) - llv(L,kp+st),kslowing+st)) * 100; res3 := ( sum(C - llv(L,kp+st*2),kslowing+st*2) / sum(hhv(H,kp+st*2) - llv(L,kp+st*2),kslowing+st*2)) * 100; res4 := ( sum(C - llv(L,kp+st*3),kslowing+st*3) / sum(hhv(H,kp+st*3) - llv(L,kp+st*3),kslowing+st*3)) * 100; res5 := ( sum(C - llv(L,kp+st*4),kslowing+st*4) / sum(hhv(H,kp+st*4) - llv(L,kp+st*4),kslowing+st*4)) * 100; res6 := ( sum(C - llv(L,kp+st*5),kslowing+st*5) / sum(hhv(H,kp+st*5) - llv(L,kp+st*5),kslowing+st*5)) * 100; res7 := ( sum(C - llv(L,kp+st*6),kslowing+st*6) / sum(hhv(H,kp+st*6) - llv(L,kp+st*6),kslowing+st*6)) * 100; res8 := ( sum(C - llv(L,kp+st*7),kslowing+st*7) / sum(hhv(H,kp+st*7) - llv(L,kp+st*7),kslowing+st*7)) * 100; res9 := ( sum(C - llv(L,kp+st*8),kslowing+st*8) / sum(hhv(H,kp+st*8) - llv(L,kp+st*8),kslowing+st*8)) * 100; res10 := ( sum(C - llv(L,kp+st*9),kslowing+st*9) / sum(hhv(H,kp+st*9) - llv(L,kp+st*9),kslowing+st*9)) * 100;
[name =Fill; linestyle=fill] [color =rgb(0,0,255)] res1; res2; [color =rgb(64,0,255)] res2; res3; [color =rgb(128,0,255)] res3; res4; [color =rgb(192,0,255)] res4; res5; [color =rgb(255,0,255)] res5; res6; [color =rgb(255,0,192)] res6; res7; [color =rgb(255,0,128)] res7; res8; [color =rgb(255,0,64)] res8; res9; [color =rgb(255,0,0)] res9; res10; [linestyle =solid; width=1; Colour=Black;] res1; [linestyle =Dash; width=1; Colour=Red;] Res10; |
|
|
BC User since June 2007
|
|
|
|
|
jazza
Regular 

Joined: 10 Aug 2007 Posts: 33 |
Post Options
Quote Reply
Posted: 20 Oct 2012 at 4:46pm |
|
Hi cmacdon, Thanks for the DTOSC coding addition and the Swami stochastics. Once again some great coding and new indicator additions. Mucho appreciated |
|
|
|
|
cmacdon
BullCharts Guru
Joined: 09 Sep 2012 Location: Brisbane Posts: 236 |
Post Options
Quote Reply
Posted: 20 Oct 2012 at 8:35pm |
|
Jazza
Just to clarify. I could not convert Swaqmi chart code to Bullcharts. The variation of stochastics I posted is different. Set out below is a proper Swami Stochastic indicator from another program so you can see the difference. 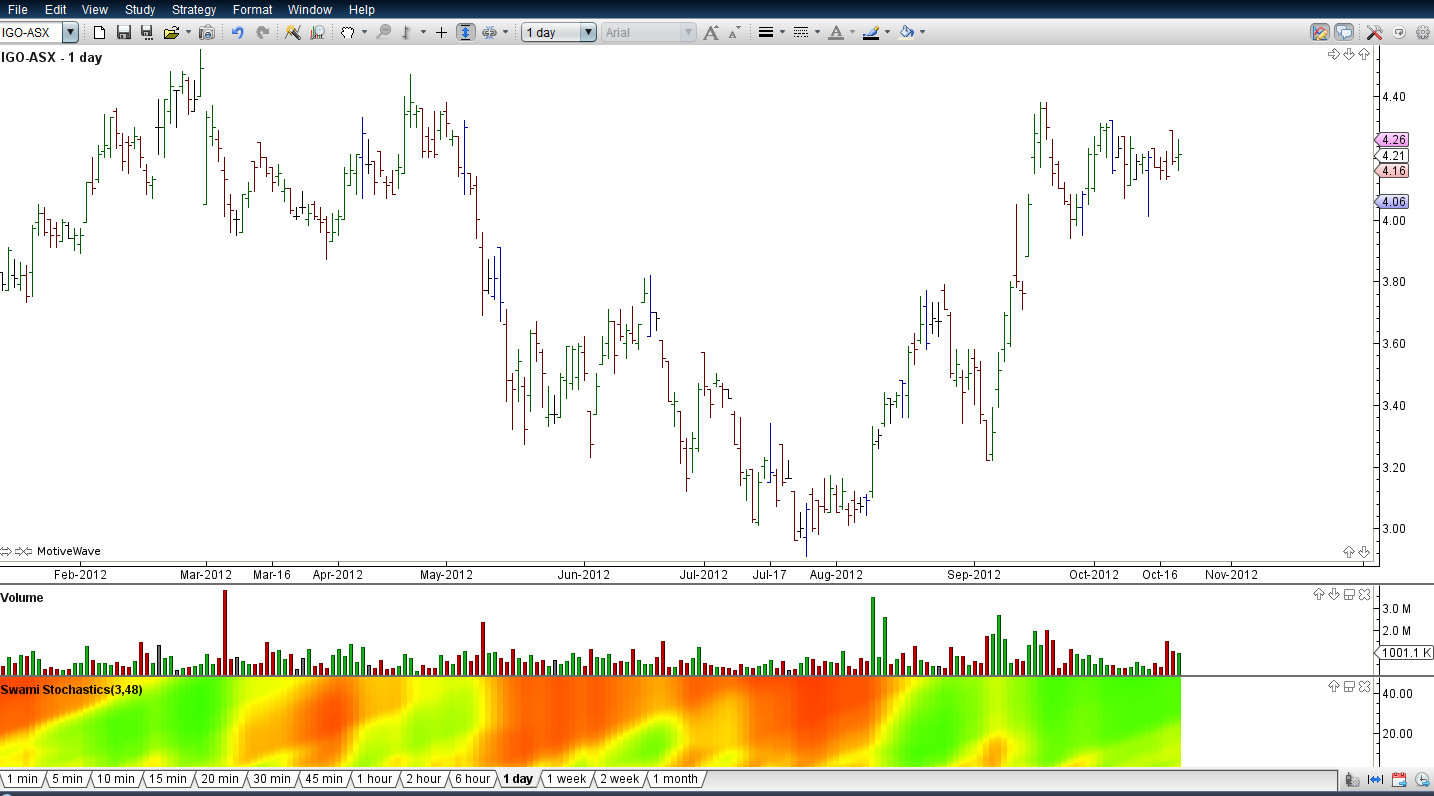 . . |
|
|
BC User since June 2007
|
|
|
|
|
Post Reply
|
| Forum Jump | Forum Permissions You cannot post new topics in this forum You cannot reply to topics in this forum You cannot delete your posts in this forum You cannot edit your posts in this forum You cannot create polls in this forum You cannot vote in polls in this forum |


