Heikin - Ashi Candlesticks |
Post Reply 
|
Page 123 5> |
| Author |
 Printable Version Printable Version Delicious Delicious Digg Digg Facebook Facebook Furl Furl Google Boomarks Google Boomarks Google Buzz Google Buzz MySpace MySpace Newsvine Newsvine reddit reddit StumbleUpon Translate StumbleUpon Translate Twitter Twitter Windows Live Windows Live Yahoo Bookmarks Yahoo Bookmarks Topic Search Topic Search  Topic Options Topic Options
|
jazza 
Regular 

Joined: 10 Aug 2007 Posts: 33 |
 Post Options Post Options
 Quote Reply Quote Reply
 Topic: Heikin - Ashi Candlesticks Topic: Heikin - Ashi CandlesticksPosted: 09 Sep 2012 at 2:28am |
|
I am stumped trying to change the default colors in the Heikin – Ashi Bullscript indicator. It shows candles with a higher close than open as color Blue. Lower close than open candles are in White. This is of course the opposite of what we are used to with any candle pattern. I am trying to reverse this color coding. Have spent lots of time getting nowhere. I am sure the answer is simple. Can one of the expert script writers help me with this one please! Thanks in advance.
|
|
 |
|
|
maximo
BullCharts Guru 

Joined: 02 Sep 2006 Location: Australia Posts: 232 |
Post Options
Quote Reply
Posted: 09 Sep 2012 at 2:07pm |
|
I managed to get the bars a different colour depending on trend, but couldn't get the down bars to solid fill.
[citation ="'Using The Heikin-Ashi Technique', by Dan Valcu Stocks & Commodities Feb 2004 www.traders.com"][target =Price]haClose := ( O+H+L+C)/4;haOpen := ( prev + hist(haClose,1))/2;haHigh := max(H, haOpen, haClose);haLow := min(L, haOpen, haClose);[linestyle =Candle][color =lime green]if (haOpen < haClose,haOpen,undefined);if (haOpen < haClose,haHigh,undefined);if (haOpen < haClose,haLow,undefined);if (haOpen < haClose,haClose,undefined);[linestyle =Candle][color =red]If (haOpen >= haClose,haOpen,undefined);If (haOpen >= haClose,haHigh,undefined);If (haOpen >= haClose,haLow,undefined);If (haOpen >= haClose,haClose,undefined);Edited by maximo - 09 Sep 2012 at 2:09pm |
|
|
|
|
cmacdon
BullCharts Guru
Joined: 09 Sep 2012 Location: Brisbane Posts: 236 |
Post Options
Quote Reply
Posted: 10 Sep 2012 at 11:00am |
|
Here are 3 indicators which together form my Heiking Ashi template. On the first and thrid indicator I use 3 different colours for up and down trends and also congestion areas. Congestion is indicated by HA bar that has a top and bottom tail.
The separate indicators are 1 Heiking -Ashi bars 2 Heiking -Ashi Oscillator 3 1 Heiking -Ashi Wave volume (the second half of this indicator code is similar to that applied in recent Weiss wave post and can be easily adapted to many other Bullchart indicators where accumulated volume is needed). ------------------------------------------------------------ [citation ="'Using
The Heikin-Ashi Technique', by Dan Valcu Stocks & Commodities Feb 2004 and
Valcu, Heikin-Ashi, How to trade without candlestick Patterns, Educofin, 2011; "] {cmacdon’s
HA bars with congestion bars. Originally
called Traffic lights} [target=Price;] haClose
:= (O+H+L+C)/4; haOpen
:= (prev + hist(haClose,1))/2; haHigh
:= max(H, haOpen, haClose); haLow
:= min(L, haOpen, haClose); haCl:=((O+H+L+C)/4+haOpen+Max((O+H+L+C)/4,Max(H,haOpen))+Min((O+H+L+C)/4,Min(L,haOpen)))/4; Greenlight:=Hahigh-haopen; Redlight:=Halow-haOpen; {I changed this to a difference calculation so as to
net off the minor congestion amounts to whatever is net up or down trend.} LightDiff:=Greenlight+Redlight; [linestyle=Candle;color=Green; ] If(lightdiff >=0.000,haOpen,undefined); If(lightdiff >=0.000, haHigh,undefined); If(lightdiff >=0.000, haLow,undefined); If(lightdiff >=0.000, haClose,undefined); [linestyle=Candle;color=Red; ] If(lightdiff <=0.000,haOpen,undefined); If(lightdiff <=0.000, haHigh,undefined); If(lightdiff <=0.000, haLow,undefined); If(lightdiff <=0.000, haClose,undefined); [linestyle=Candle;color=Black; ] If(Greenlight >0.000 and Redlight <-0.000,haOpen,undefined); If(Greenlight >0.000 and Redlight <-0.000,
haHigh,undefined); If(Greenlight >0.000 and Redlight <-0.000,
haLow,undefined); If(Greenlight >0.000 and Redlight <-0.000,
haClose,undefined); [citation ="'Using
The Heikin-Ashi Technique', by Dan Valcu Stocks & Commodities Feb 2004 and
Valcu, Heikin-Ashi, How to trade without candlestick Patterns, Educofin, 2011; "] {This
indicator creates an Oscillator with congestion bars absorbed into the closest
up or down trend. Valcu does not use
oscillators this way} haClose
:= (O+H+L+C)/4; haOpen
:= (prev + hist(haClose,1))/2; haHigh
:= max(H, haOpen, haClose); haLow
:= min(L, haOpen, haClose); haCl:=((O+H+L+C)/4+haOpen+Max((O+H+L+C)/4,Max(H,haOpen))+Min((O+H+L+C)/4,Min(L,haOpen)))/4; Greenlight:=HaClose-haOpen; [name=Green Traffic Lights1; linestyle=Solid; width=2] [color=Black; name=Greenlight] Greenlight; d:=0; [horzline=0]; [linestyle=fill; color=Green;] Greenlight;
[linestyle=fill; color=RED;]d; {This section shows shows lighter coloured bars as
the differences above or below zero shrink, or in otherwords, the oscillator
moves up or down from a maxima or minima.} [name=Green Traffic Lights1; linestyle=bar; width=4] [color=Green; name=Greenlight] If(Greenlight>=0,Greenlight,undefined); [name=Red Traffic Lights2; linestyle=bar; width=4] [color=Orange; name=Redlight2] If(Greenlight>=0 AND Greenlight<Hist(Greenlight,1),Greenlight,undefined); [name=Red Traffic Lights3; linestyle=bar; width=4] [color=Red; name=Redlight] If(Greenlight<0,Greenlight,undefined); [name=Red Traffic Lights4; linestyle=bar; width=4] [color=Lime; name=Redlight2] If(Greenlight<0 AND Greenlight>Hist(Greenlight,1),Greenlight,undefined); [citation ="'Using The Heikin-Ashi Technique', by Dan
Valcu Stocks & Commodities Feb 2004 and Valcu, Heikin-Ashi, How to trade
without candlestick Patterns, Educofin, 2011"] {cmacdon's HA wave vol version. Valcu does not show Volume this way.} haClose
:= (O+H+L+C)/4; haOpen
:= (prev + hist(haClose,1))/2; haHigh
:= max(H, haOpen, haClose); haLow
:= min(L, haOpen, haClose); haCl:=((O+H+L+C)/4+haOpen+Max((O+H+L+C)/4,Max(H,haOpen))+Min((O+H+L+C)/4,Min(L,haOpen)))/4; Greenlight:=Hahigh-haopen; Redlight:=Halow-haOpen; LightDiff:=Greenlight+Redlight; {The section shows the total or average wave volume
for each up or down trend or congestion areas shown by the HA bars. (The part of the formula can be easily
adapted to most other indicators by defining the parameters for the BuyVol and
downvol from any other indicator. For
instance if the indicator was a crossover of the close the set up is BuyVol
=c>Ma(c,30,s) and Down Vol<Ma(c,30,s))} v1:=input("1=Total volume on wave
or 2=Average volume on wave", 2, 1, 2); [linestyle=Bar; width=4] [name=Preferred Buy Vol; color=Green] Buyvol:=
Greenlight >=0.0000001
and Redlight
>=-0.0000000; BuyVol2:=If(BuyVol,+1*v,0); TotalBuyVol:=If( BuyVol ,+1*v+prev(BuyVol2),0); Buybars:=barssince(Buyvol2=0); if(v1=2,TotalBuyVol,undefined); if(v1=1,TotalBuyVol/buybars,undefined); [name=Preferred Sell Vol; color=Red] Sellvol:=
Greenlight <=0.0000000
and Redlight
<=0.0000001; SellVol2:=If(SellVol,+1*v,0); TotalSellVol:=If( SellVol ,+1*v+prev(SellVol2),0); Sellbars:=barssince(Sellvol2=0); if(v1=2,TotalSellVol,undefined); if(v1=1,TotalSellVol/Sellbars,undefined); {Heikin Ashi also has congestion bars. Refer Dan Valcu’s article in Tasc or his
book, “Heikin-Ashi, How to trade without candlestick Patterms, Educofin,2011 } [name=Congestion Vol; color=black] Convol:=
Greenlight >=0.0000001
and Redlight
<=-0.0000001; ConVol2:=If(ConVol,+1*v,0); TotalConVol:=If( ConVol ,+1*v+prev(ConVol2),0); Conbars:=barssince(Convol2=0); if(v1=2,TotalConVol,undefined); if(v1=1,TotalConVol/Conbars,undefined); |
|
|
|
|
Gordon7
Newbie 

Joined: 09 Sep 2012 Location: Sydney Posts: 6 |
Post Options
Quote Reply
Posted: 10 Sep 2012 at 1:56pm |
|
Thanks very much for the above coding guys, very much appreciated.
Has anyone coded Valcu's haDelta indicator which he uses in conjunction with the heikin-ashi chart and as an early warning of trend change ? Would love to have this or something similar. Gordon |
|
|
|
|
jazza
Regular
Joined: 10 Aug 2007 Posts: 33 |
Post Options
Quote Reply
Posted: 10 Sep 2012 at 2:47pm |
|
Maximo, that’s certainly an improvement visually. As always,
thanks very much for your tireless input. Mucho appreciated. Cheers. Still curious as to why the down candles can’t be solid
filled? Hopefully one of the Bullcharts programmers might have a solution. Gordon, thanks very much for sharing your HA formulas and
template. Looks very interesting Will study and analyze . Great coding. Cheers. |
|
|
|
|
Gordon7
Newbie
Joined: 09 Sep 2012 Location: Sydney Posts: 6 |
Post Options
Quote Reply
Posted: 10 Sep 2012 at 3:35pm |
No, that was cmacdon who shared his formulas. Credit where credit is due  Gordon |
|
|
|
|
cmacdon
BullCharts Guru
Joined: 09 Sep 2012 Location: Brisbane Posts: 236 |
Post Options
Quote Reply
Posted: 10 Sep 2012 at 6:53pm |
|
Tried coding HA delta when Valcus book came out but, in my opinion, it is more erratic than the Ha oscillator provided above.
|
|
|
BC User since June 2007
|
|
|
|
|
jazza
Regular
Joined: 10 Aug 2007 Posts: 33 |
Post Options
Quote Reply
Posted: 11 Sep 2012 at 1:23am |
|
Dan Valcu uses this setup on his website. It has his "ha Delta>SMA(haDelta,3)"
This is to overcome the lagging aspects of the Heikin-Ashi. His formula description from the website: " The difference between ha Close and ha Open. Combined with a 3 day simple moving av. SMA(3). Visually it looks like a momentum oscillator as per below. Well beyond my script writing skills. Can I call on some more help again please. Mucho appreciated in advance. 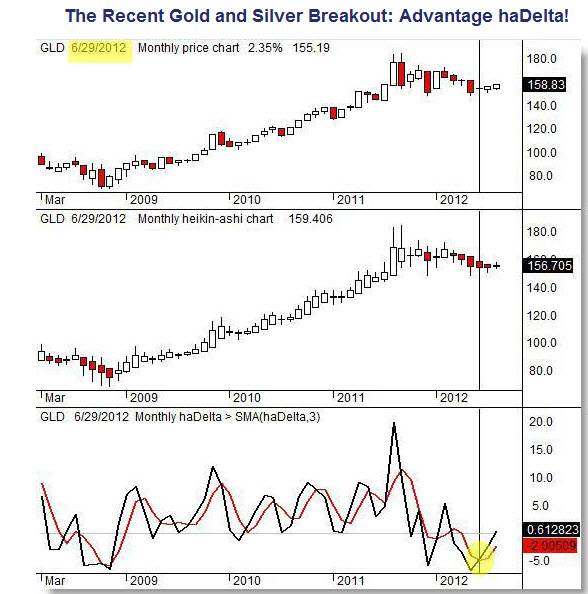 |
|
|
|
|
cmacdon
BullCharts Guru
Joined: 09 Sep 2012 Location: Brisbane Posts: 236 |
Post Options
Quote Reply
Posted: 11 Sep 2012 at 7:28am |
|
I dug this out of my archived indicators
I think ha Delta is haclose -haOpen otherwise you get an inverted oscilator. haClose := ( O+H+L+C)/4; haOpen := ( prev + hist(haClose,1))/2; haHigh := max(H, haOpen, haClose); haLow := min(L, haOpen, haClose); haCl:=(( O+H+L+C)/4+haOpen+Max((O+H+L+C)/4,Max(H,haOpen))+Min((O+H+L+C)/4,Min(L,haOpen)))/4;
[linestyle =solid; width=2] [name =haDelta; color=Green] haDelta:= haClose-haOpen; haDelta; [linestyle =solid; width=2] [name =SMAhaDelta; color=Red] Sdelta:= ma(haDelta,3,s); sdelta; [horzline =0] |
|
|
BC User since June 2007
|
|
|
|
|
cmacdon
BullCharts Guru
Joined: 09 Sep 2012 Location: Brisbane Posts: 236 |
Post Options
Quote Reply
Posted: 11 Sep 2012 at 7:44am |
|
incidentally, the first indicator I sent through yesterday is the same as haDelta with out the 3 day Ma of Delta.
haDelta is effectively the body of a ha bar without the tails.
|
|
|
BC User since June 2007
|
|
|
|
|
Post Reply
|
Page 123 5> |
| Forum Jump | Forum Permissions You cannot post new topics in this forum You cannot reply to topics in this forum You cannot delete your posts in this forum You cannot edit your posts in this forum You cannot create polls in this forum You cannot vote in polls in this forum |


