Joe Ross consolidation |
Post Reply 
|
Page <123> |
| Author |
 Printable Version Printable Version Delicious Delicious Digg Digg Facebook Facebook Furl Furl Google Boomarks Google Boomarks Google Buzz Google Buzz MySpace MySpace Newsvine Newsvine reddit reddit StumbleUpon Translate StumbleUpon Translate Twitter Twitter Windows Live Windows Live Yahoo Bookmarks Yahoo Bookmarks Topic Search Topic Search  Topic Options Topic Options
|
cmacdon 
BullCharts Guru 
Joined: 09 Sep 2012 Location: Brisbane Posts: 236 |
 Post Options Post Options
 Quote Reply Quote Reply
 Posted: 22 Dec 2012 at 9:21am Posted: 22 Dec 2012 at 9:21am |
|
1. Trading the Ross Hook
2.The Law of Charts 3. Presentation on Traders Trick Entry
|
|
|
BC User since June 2007
|
|
 |
|
|
charlie_8
Regular 
Joined: 06 Apr 2011 Posts: 21 |
Post Options
Quote Reply
Posted: 23 Dec 2012 at 5:48am |
|
Charles, my indicator based on Chapter 5 "Identifying Congestion" from "Trading the Ross Hook". I'm using both definition of congestion given by Ross in ths Chapter. But as I said I'm using it on multiplen timeframes.
The last presentation is in German, isn't it? Happy reading! Edited by charlie_8 - 23 Dec 2012 at 5:53am |
|
|
|
|
cmacdon
BullCharts Guru
Joined: 09 Sep 2012 Location: Brisbane Posts: 236 |
Post Options
Quote Reply
Posted: 23 Dec 2012 at 11:09am |
|
Charlie_b
Here is congestion Rule from Appendix of Joe Ross Book RULE: ANY TIME PRICES OPEN
OR CLOSE ON FOUR CONSECUTIVE BARS, WITHIN THE CONFINES
OF THE RANGE OF A “MEASURING BAR,” YOU HAVE CONGESTION. THIS IS REGARDLESS OF
WHERE THE HIGHS AND LOWS MAY BE LOCATED. A “MEASURING BAR” BECOMES SUCH BY
VIRTUE OF ITS PRICE RANGE CONTAINING THE
OPENS OR CLOSES OF AT LEAST 3 OF 4 SUBSEQUENT PRICE BARS. It is essentially the same as code previously posted above and seems to replkicate the boxes on LNC charts you posted above. I have tidied up the code by inserting Hoz Step and Fill step atrtibutes and a clearer color for the fill. So now you only have to go into the Advanced Tab and insert -4 in the Horizontal shift box when you apply the indicator and it will work as intended. The horz step in Bulllcharts does not truncate after 4 bars and extends until such time as a new box isformed by the indicator trigger and that is why you sometimes get staggered boxes on the chart. The extension of the Horz step may not be a bad thing as it clearly shows breakouts and Joe Ross seems to have three categories of Congestion Sideways price movement may be broken
into three distinct and definable areas: 1. Ledges ¾ consisting of no more
than 10 price bars 2. Congestions ¾ 11-20 price bars
inclusive 3. Trading Ranges ¾ 21 bars or more with
a breakout usually occurring on price bars 21-29 inclusive. [Description ="Joe Ross Consolidation"]
[target =price;]
a:= If(((O<Hist(H,4) and O> Hist(L,4)) OR (C<Hist(H,4) and C> Hist(L,4)))
AND ((Hist(O,1)<Hist(H,4) and Hist(O,1)> Hist(L,4)) OR (Hist(C,1)<Hist(H,4) and Hist(C,1)> Hist(L,4)))
AND ((Hist(O,2)<Hist(H,4) and Hist(O,2)> Hist(L,4)) OR (Hist(C,2)<Hist(H,4) and Hist(C,2)> Hist(L,4)))
AND ((Hist(O,3)<Hist(H,4) and Hist(O,3)> Hist(L,4)) OR (Hist(C,3)<Hist(H,4) and Hist(C,3)> Hist(L,4))),1,0);
{ Top Line}
[name =Top line; linestyle=Horz Step; color=Black; width=1]
JRH:= If((a=1),Hist(H,4) ,Undefined);
JRH;
{ Bottom Line }
[name =Bottom Line; linestyle=Horz Step; color=Black; width=1]
JRL:= If((a=1),Hist(L,4),Undefined);
JRL;
{ Infill colour on Trends }
[name =Fill colour; linestyle=fill Step]
[color =Cyan] Valuewhen(1,JRH,Hist(H,4));
[color =Cyan] Valuewhen(1,JRL,Hist(L,4)); |
|
|
BC User since June 2007
|
|
|
|
|
cmacdon
BullCharts Guru
Joined: 09 Sep 2012 Location: Brisbane Posts: 236 |
Post Options
Quote Reply
Posted: 25 Dec 2012 at 9:23am |
|
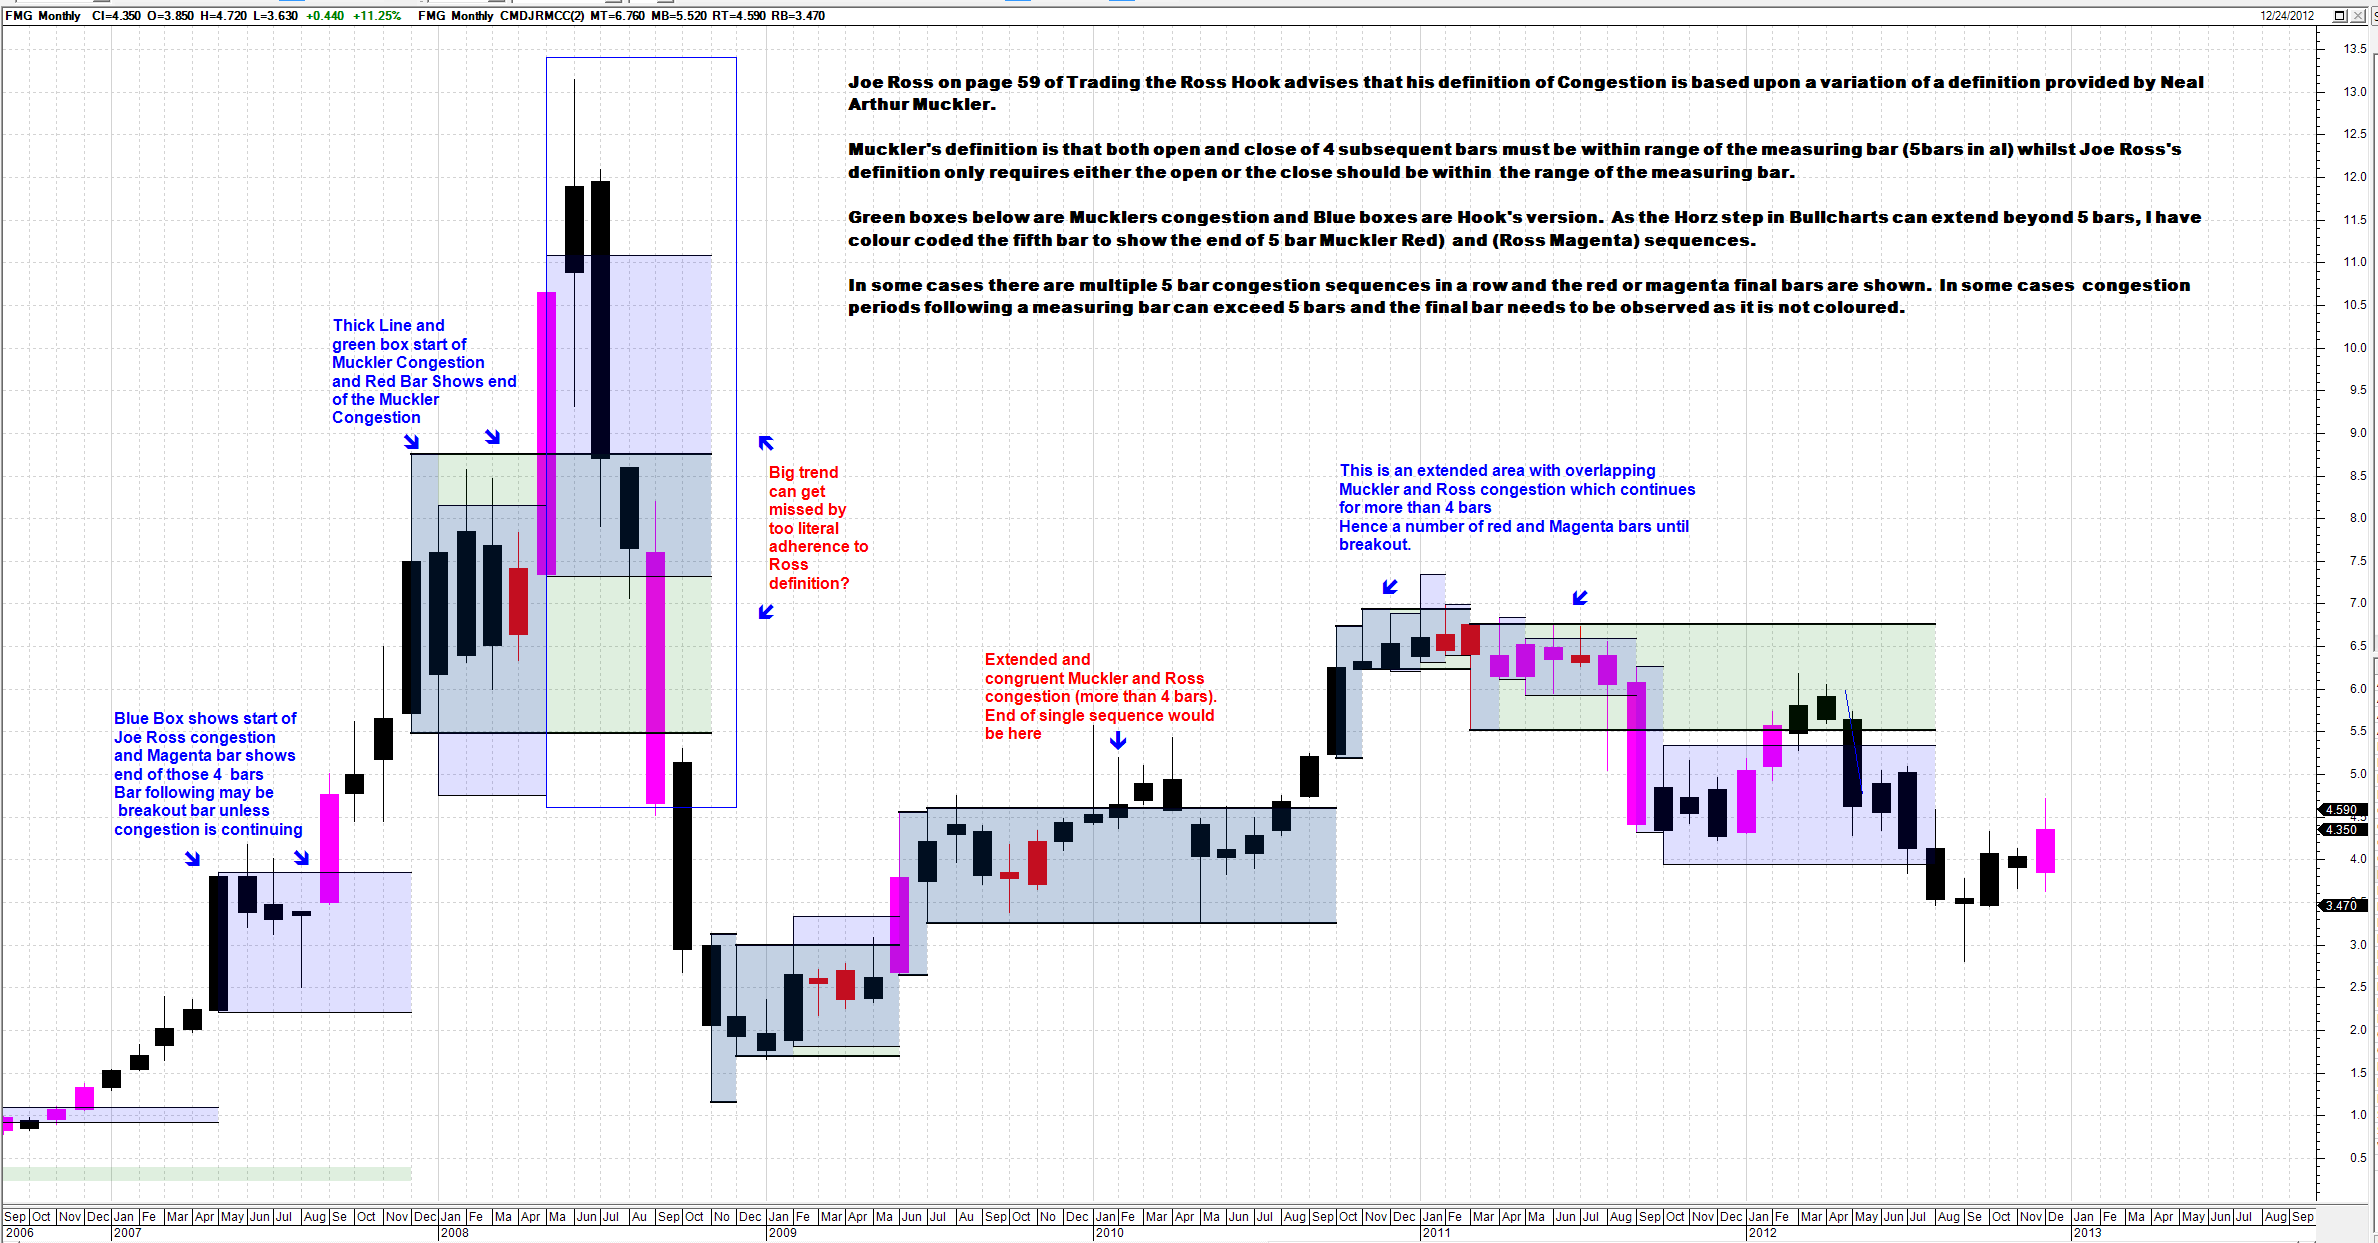
Charlie_B Rereading chapter 5, your original code above seems to be the Neal Arthur Muckler congestion definition which Joe Ross states he then varied for his definition of congestion p59. So here is amalgam code of both definitions. You can swith either on or off in the styles tab. Still insert Horizontal shift -4 in the advance tab to align the indicator properly. I also coloured red or Magenta the final bar in the definition sequences to try and overcome the Horxstep being extended beyond 5 bar. I used teh fill candle option in candlesticks In many cases the bar following a coloured bar is the breakout bar but not all cases see notes on the chart. Merry Christmas Self explanatory chart and code posted below showing both Muckler and Ross Congestion[Description ="Joe Ross Identifying Congestion Chapter 5 Trading the Ross Hook"] [target =price;] { This was the original Congestion Formula provided to Joe Ross by Neal Arthur Muckler p.59} a:= If(((O<Hist(H,4) and O> Hist(L,4)) AND (C<Hist(H,4) and C> Hist(L,4))) AND ((Hist(O,1)<Hist(H,4) and Hist(O,1)> Hist(L,4)) AND (Hist(C,1)<Hist(H,4) and Hist(C,1)> Hist(L,4))) AND ((Hist(O,2)<Hist(H,4) and Hist(O,2)> Hist(L,4)) AND (Hist(C,2)<Hist(H,4) and Hist(C,2)> Hist(L,4))) AND ((Hist(O,3)<Hist(H,4) and Hist(O,3)> Hist(L,4)) AND (Hist(C,3)<Hist(H,4) and Hist(C,3)> Hist(L,4))),1,0);
{ This was the Joe Ross variation to the above formula p.59} a1:= If(((O<Hist(H,4) and O> Hist(L,4)) OR (C<Hist(H,4) and C> Hist(L,4))) AND ((Hist(O,1)<Hist(H,4) and Hist(O,1)> Hist(L,4)) OR (Hist(C,1)<Hist(H,4) and Hist(C,1)> Hist(L,4))) AND ((Hist(O,2)<Hist(H,4) and Hist(O,2)> Hist(L,4)) OR (Hist(C,2)<Hist(H,4) and Hist(C,2)> Hist(L,4))) AND ((Hist(O,3)<Hist(H,4) and Hist(O,3)> Hist(L,4)) OR (Hist(C,3)<Hist(H,4) and Hist(C,3)> Hist(L,4))),1,0);
{Muckler Top Line} [name =MTop line; linestyle=Horz Step; color=Black; width=2;] MH:= If((a=1),Hist(H,4),Undefined); MH;
{Muckler Bottom Line } [name =MBottom Line; linestyle=Horz Step; color=Black; width=2;] ML:= If((a=1),Hist(L,4),Undefined); ML;
{M Infill colour on Trends } [name =MucklerCongestion fill; linestyle=fill Step] [color =Green] Valuewhen(1,MH,Hist(H,4)); [color =Green] Valuewhen(1,ML,Hist(L,4));
{Joe Ross Variation Top Line} [name =RTop line; linestyle=Horz Step; color=Black; width=1;] JRH1:= If((a1=1),Hist(H,4) ,Undefined); JRH1; {Joe Ross Variation Bottom Line } [name =RBottom Line; linestyle=Horz Step; color=Black; width=1;] JRL1:= If((a1=1),Hist(L,4),Undefined); JRL1; {R Infill colour on Trends } [name =Ros Congestion Fill color; linestyle=fill Step] [color =Blue] Valuewhen(1,JRH1,Hist(H,4)); [color =Blue] Valuewhen(1,JRL1,Hist(L,4));
[Visible =True;] [target =Price; linestyle=PriceColor]
[name =Muckler Congestion Bars;Color=Red] If ( a,1,0); [name =Ross Congestion Bars;Color=Magenta] If ( a1, 1, 0);
|
|
|
BC User since June 2007
|
|
|
|
|
cmacdon
BullCharts Guru
Joined: 09 Sep 2012 Location: Brisbane Posts: 236 |
Post Options
Quote Reply
Posted: 25 Dec 2012 at 9:25am |
|
|
|
BC User since June 2007
|
|
|
|
|
charlie_8
Regular
Joined: 06 Apr 2011 Posts: 21 |
Post Options
Quote Reply
Posted: 26 Dec 2012 at 8:49am |
|
Dear Charles!
I'm extremly gratefull to you for your help! I wish you and other forum members merry xmas! As far I know for Muckler's consolidation only C of 4 subsequent bars are important (regardless where O are). But I think that your version with O and C is very interestimg, too! Edited by charlie_8 - 26 Dec 2012 at 9:40am |
|
|
|
|
cmacdon
BullCharts Guru
Joined: 09 Sep 2012 Location: Brisbane Posts: 236 |
Post Options
Quote Reply
Posted: 26 Dec 2012 at 10:39am |
|
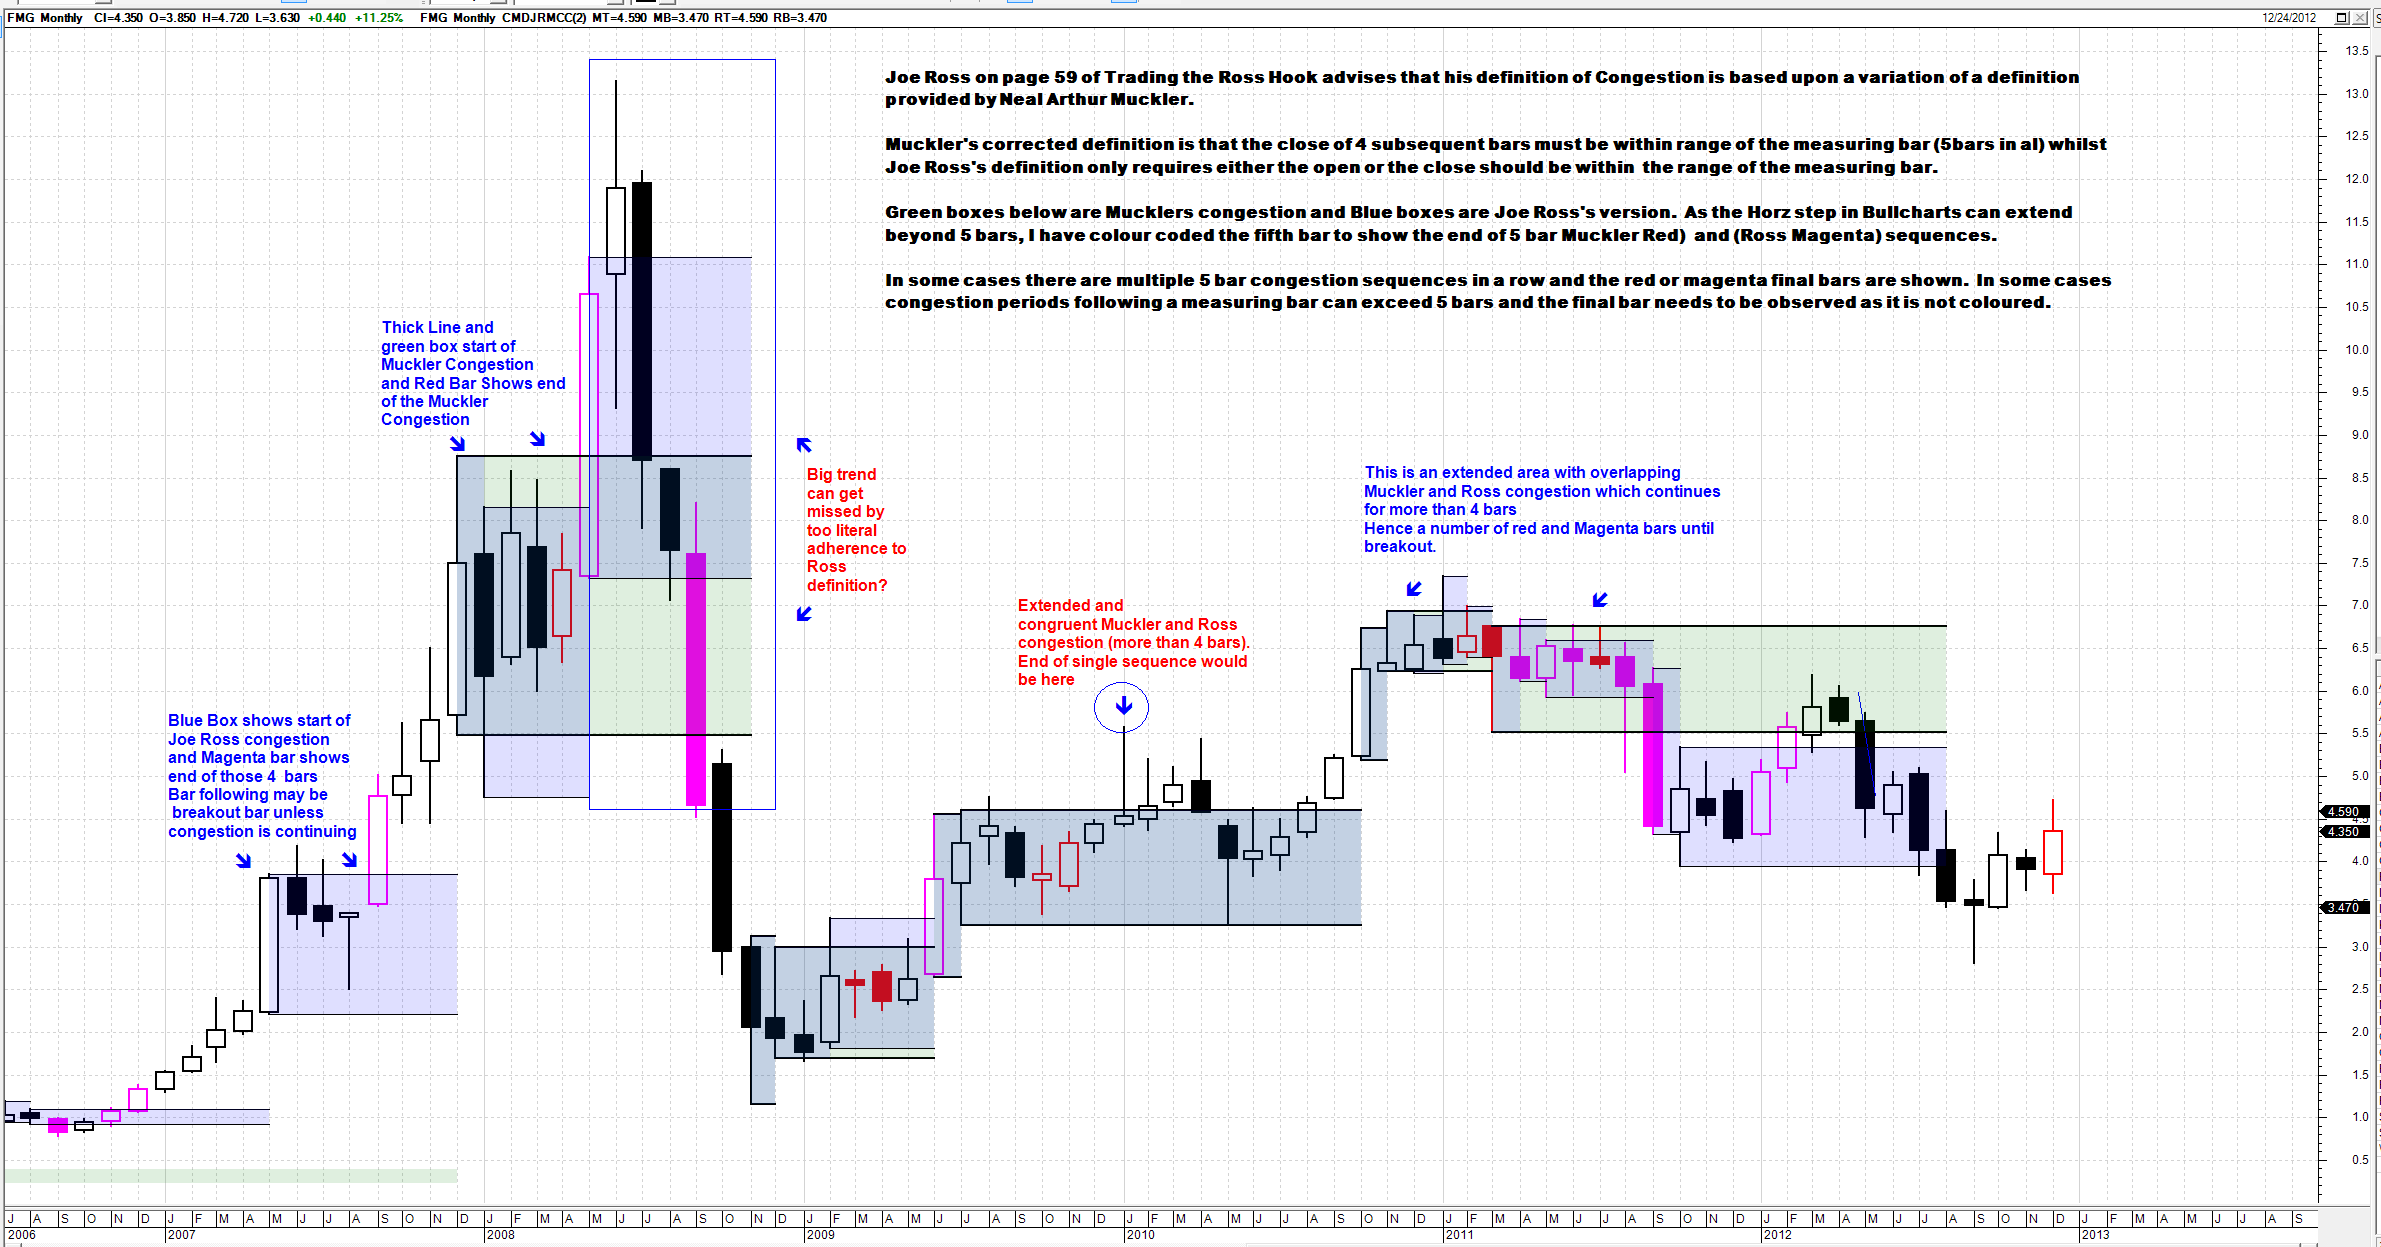
Charlie-B
Your quite right Rereading again Mucklers version is all C within measuring bar ignoring open. Here is amended code and same FMG Chart monthly but without candle colour Fills. I think I have circled the only breakout change caused by excluding the opens in Muklers corrected code the breakout to an Jan 10 J from Feb 2012 is one bar earlier. [Description ="Joe Ross Identifying Congestion Chapter 5 Trading the Ross Hook"] [target =price;] { This was the original Congestion Formula provided to Joe Ross by Neal Arthur Muckler p.59} a:= If((C<Hist(H,4) and C> Hist(L,4)) AND (Hist(C,1)<Hist(H,4) and Hist(C,1)> Hist(L,4)) AND (Hist(C,2)<Hist(H,4) and Hist(C,2)> Hist(L,4)) AND (Hist(C,3)<Hist(H,4) and Hist(C,3)> Hist(L,4)),1,0);
{ This was the Joe Ross variation to the above formula p.59} a1:= If(((O<Hist(H,4) and O> Hist(L,4)) OR (C<Hist(H,4) and C> Hist(L,4))) AND ((Hist(O,1)<Hist(H,4) and Hist(O,1)> Hist(L,4)) OR (Hist(C,1)<Hist(H,4) and Hist(C,1)> Hist(L,4))) AND ((Hist(O,2)<Hist(H,4) and Hist(O,2)> Hist(L,4)) OR (Hist(C,2)<Hist(H,4) and Hist(C,2)> Hist(L,4))) AND ((Hist(O,3)<Hist(H,4) and Hist(O,3)> Hist(L,4)) OR (Hist(C,3)<Hist(H,4) and Hist(C,3)> Hist(L,4))),1,0);
{Muckler Top Line} [name =MTop line; linestyle=Horz Step; color=Black; width=2;] MH:= If((a=1),Hist(H,4),Undefined); MH;
{Muckler Bottom Line } [name =MBottom Line; linestyle=Horz Step; color=Black; width=2;] ML:= If((a=1),Hist(L,4),Undefined); ML;
{M Infill colour on Trends } [name =MucklerCongestion fill; linestyle=fill Step] [color =Green] Valuewhen(1,MH,Hist(H,4)); [color =Green] Valuewhen(1,ML,Hist(L,4));
{Joe Ross Variation Top Line} [name =RTop line; linestyle=Horz Step; color=Black; width=1;] JRH1:= If((a1=1),Hist(H,4) ,Undefined); JRH1; {Joe Ross Variation Bottom Line } [name =RBottom Line; linestyle=Horz Step; color=Black; width=1;] JRL1:= If((a1=1),Hist(L,4),Undefined); JRL1; {R Infill colour on Trends } [name =Ros Congestion Fill color; linestyle=fill Step] [color =Blue] Valuewhen(1,JRH1,Hist(H,4)); [color =Blue] Valuewhen(1,JRL1,Hist(L,4));
[Visible =True;] [target =Price; linestyle=PriceColor]
[name =Muckler Congestion Bars;Color=Red] If ( a,1,0); [name =Ross Congestion Bars;Color=Magenta] If ( a1, 1, 0);
|
|
|
BC User since June 2007
|
|
|
|
|
cmacdon
BullCharts Guru
Joined: 09 Sep 2012 Location: Brisbane Posts: 236 |
Post Options
Quote Reply
Posted: 26 Dec 2012 at 10:40am |
|
|
|
BC User since June 2007
|
|
|
|
|
charlie_8
Regular
Joined: 06 Apr 2011 Posts: 21 |
Post Options
Quote Reply
Posted: 26 Dec 2012 at 11:08am |
|
Thank you again Charles!
Again, regardless of that it was a mistake, you caugt a very interesting point! I think I'll take a closer look to you "false" Muckler's congestion. |
|
|
|
|
cmacdon
BullCharts Guru
Joined: 09 Sep 2012 Location: Brisbane Posts: 236 |
Post Options
Quote Reply
Posted: 26 Dec 2012 at 10:22pm |
|
Charlie-B
I think this will be is my last post on this subject. Here is a couple of options for the indicator variations where: 1) I colour coded the bars after the 5 bar sequence, Blue if the close of the bars stay in the congestion zone green for upside breakouts and trends, and red for down side breakouts and trends. 2) I also set up an option to show congestion if the starting bar is narrow spread, Widespread or Ultrawidespread. (From a Whyckoff/VSA perspective Ultra widespread is more a climatic indication and Narrow Spread Smart money is in controll feeding enough supply or demand to keep price stable), So you can play with that option if you wish. I was also concerned a bit that a very wide measuring bar is likely to show congestion whereas a nice tredn might be missed e.g. the chart example above. Selecting 4 as the option should give the usuall Joe Ross version of Congestion from any measuring bar. Horizontal shift -4 still required. Indicator seesm to work well on intraday charts. [Description ="Joe Ross Identifying Congestion Chapter 5 Trading the Ross Hook"] [target =price;] [Description ="Joe Ross Identifying Congestion Chapter 5 Trading the Ross Hook"]
MB:= input("Measuring bar 1=NS,2=WS,3=UltraWS, 4 =Combined", 1, 1, 4); prd2:= input("Period for Total Spread MA", 10, 1, 200); Cut:= input("Narrow Spread Cut off", 0.65, .05, 0.8); Cut2:= input("UltraWS Cut off", 1.3, .05, 2.0); method := inputma("Method",SIMPLE); { THExLo:=input("Extreme Low Vol Maximum Threshold", 0.60, .1, 2); THLo:=input("Maximum for Low Vol Threshold", 0.9, .1, 2); THNo:=input("Ultra High Minimum Vol Threshold", 1.5, .1, 2.00);} Range := H - L; NS:=(Range<=Cut* ma(Range,prd2,method)); WS:=(Range>Cut* ma(Range,prd2,method) ) and (Range<Cut2* ma(Range,prd2,method)); UltraWS:=(Range>=Cut2* ma(Range,prd2,method) ); UltraBear:= C<=((Range*0.2)+L); Bear:= C>((Range*0.2)+L) AND C<((Range*0.50)+L); Bull:= C>=((Range*0.50)+L) AND C<((Range*0.80)+L); UltraBull:= C>=((Range*0.80)+L); {------------------------------------------------------------------------------------------}
{ This was the Joe Ross variation to the above formula p.59} a1:= ( If (MB=1,NS, IF (MB=2,WS, If (MB=3,UltraWS, If (MB=4, (NS OR WS OR UltraWS), undefined ))))) AND If(((O<Hist(H,4) and O> Hist(L,4)) OR (C<Hist(H,4) and C> Hist(L,4))) AND ((Hist(O,1)<Hist(H,4) and Hist(O,1)> Hist(L,4)) OR (Hist(C,1)<Hist(H,4) and Hist(C,1)> Hist(L,4))) AND ((Hist(O,2)<Hist(H,4) and Hist(O,2)> Hist(L,4)) OR (Hist(C,2)<Hist(H,4) and Hist(C,2)> Hist(L,4))) AND ((Hist(O,3)<Hist(H,4) and Hist(O,3)> Hist(L,4)) OR (Hist(C,3)<Hist(H,4) and Hist(C,3)> Hist(L,4))),1,0);
{Joe Ross Variation Top Line} [name =RTop line; linestyle=Horz Step; color=Black; width=1;] JRH:= If((a1=1),Hist(H,4) ,Undefined); JRH; {Joe Ross Variation Bottom Line } [name =RBottom Line; linestyle=Horz Step; color=Black; width=1;] JRL:= If((a1=1),Hist(L,4),Undefined); JRL; {R Infill colour on Trends } [name =Ros Congestion Fill color; linestyle=fill Step] [color =Blue] Valuewhen(1,JRH,Hist(H,4)); [color =Blue] Valuewhen(1,JRL,Hist(L,4));
{This section colours the trend after breakouts} [Visible =True;] [target =Price; linestyle=PriceColor] {Colour for Joe Ross Congestion Breaskouts} [color =Lime Green] Close>Valuewhen(1,JRH, Hist(H,4)); [color =Medium Slate Blue] Close<=Valuewhen(1,JRH,Hist(H,4))and Close>=Valuewhen(1,JRL,Hist(L,4)); [color =red] true;
|
|
|
BC User since June 2007
|
|
|
|
|
Post Reply
|
Page <123> |
| Forum Jump | Forum Permissions You cannot post new topics in this forum You cannot reply to topics in this forum You cannot delete your posts in this forum You cannot edit your posts in this forum You cannot create polls in this forum You cannot vote in polls in this forum |


