Multiple colours on single indicator line |
Post Reply 
|
Page 12> |
| Author |
 Printable Version Printable Version Delicious Delicious Digg Digg Facebook Facebook Furl Furl Google Boomarks Google Boomarks Google Buzz Google Buzz MySpace MySpace Newsvine Newsvine reddit reddit StumbleUpon Translate StumbleUpon Translate Twitter Twitter Windows Live Windows Live Yahoo Bookmarks Yahoo Bookmarks Topic Search Topic Search  Topic Options Topic Options
|
IT-Trader 
Regular 
Joined: 10 Nov 2005 Posts: 23 |
 Post Options Post Options
 Quote Reply Quote Reply
 Topic: Multiple colours on single indicator line Topic: Multiple colours on single indicator linePosted: 24 Mar 2006 at 5:48pm |
|
Take a simple indicator such as CCI(14) and plot it.
I'd like to set it so that when it's above 0 the line is green and when it's below 0 the line is red. Is this possible? Thanks, ITT. |
|
 |
|
|
Brendon
BullCharts Staff 

Joined: 10 Sep 2004 Location: Australia Posts: 126 |
Post Options
Quote Reply
Posted: 27 Mar 2006 at 11:46am |
|
Shall do a sample for you.
|
|

|
|
|
|
|
IT-Trader
Regular
Joined: 10 Nov 2005 Posts: 23 |
Post Options
Quote Reply
Posted: 27 Mar 2006 at 5:14pm |
|
Thanks Brendon, that would really be appreciated.
Along similar lines possibly, I'd like the volume histogram to be blue on days when price closes up and red when price closes down. (...and maybe variations like C versus O, or today's H vs yest. H, but they are wish list rather than having an immediate use). My mind is a little addled today so I can't seem to work it out. Many thanks for your continued support, ITT. Edited by IT-Trader |
|
|
|
|
Brendon
BullCharts Staff
Joined: 10 Sep 2004 Location: Australia Posts: 126 |
Post Options
Quote Reply
Posted: 29 Mar 2006 at 4:55pm |
|
This is the closest we can can up with - needs to be Bar style to make it easier to read. [horzline=0] n := input("Time periods",14,1); [color=rgb(000,000,255);name=up; Linestyle=Bar] if(cci(n)>=0,cci(n),0); [color=rgb(255,000,000);name=down; Linestyle=Bar] if(cci(n)<=0,cci(n),0);
|
|
|
|
|
|
|
|
IT-Trader
Regular
Joined: 10 Nov 2005 Posts: 23 |
Post Options
Quote Reply
Posted: 30 Mar 2006 at 11:14am |
|
Hi Brendon,
That works exactly as hoped for the second question about volume and I think I can work a variant to make line indicators (like cci) suit the purpose I had in mind. Many thanks for the help again. ITT. btw, for anyone else the volume version looked like this.... [color=rgb(000,000,255);name=up; Linestyle=bar] if(C>O,V,0); [color=rgb(255,000,000);name=down; Linestyle=bar] if(C<O,V,0); I find it useful to distinguish between the volume on up-days vs down-days. |
|
|
|
|
Owen
Regular
Joined: 15 Nov 2004 Posts: 97 |
Post Options
Quote Reply
Posted: 08 Apr 2006 at 12:46pm |
|
IT-Trader, you can also try the Fill attribute. e.g.
[linestyle=fill; color=green; transparency=50] cci(14); [color=red; transparency=50] 0 For the 2nd Q, I simply right click and change the color property of the volume panel to colour the volumes. I'm not sure if that's what you are after. |
|
|
|
|
IT-Trader
Regular
Joined: 10 Nov 2005 Posts: 23 |
Post Options
Quote Reply
Posted: 18 Apr 2006 at 10:37am |
|
Owen,
The fill style is simply filling the the gap below/above the indicator, it was actually getting the indicator line itself to be green above a predertimed number and red below it. From Brendon's comments, it sounds like this isn't possible. It's far from being a big deal, I asked in case I'd missed something. (The CCI was only used as an example to keep it simple.) On the volume colour question, you have indeed misunderstood. Your suggestion would change all the volume days to be a single colour. The code I posted shows the volume in blue on days when the C is above the O, and in red on days when the C is below the O. However, there is one circumstance I forgot to cover, those when O=C, I've since added and extra line to plot volume in balck on those days. It may not appear overly helpful but it speeds up part of my selection process. ITT. |
|
|
|
|
Owen
Regular
Joined: 15 Nov 2004 Posts: 97 |
Post Options
Quote Reply
Posted: 18 Apr 2006 at 11:21am |
|
IT-Trader, is this what you need?
 |
|
|
|
|
IT-Trader
Regular
Joined: 10 Nov 2005 Posts: 23 |
Post Options
Quote Reply
Posted: 18 Apr 2006 at 11:44am |
|
LOL - yeah that's it.
You realise, of course, that all this is moot! Thanks anyway. ITT. (btw, do you think you could have made the chart a bit bigger!) |
|
|
|
|
Owen
Regular
Joined: 15 Nov 2004 Posts: 97 |
Post Options
Quote Reply
Posted: 18 Apr 2006 at 12:44pm |
|
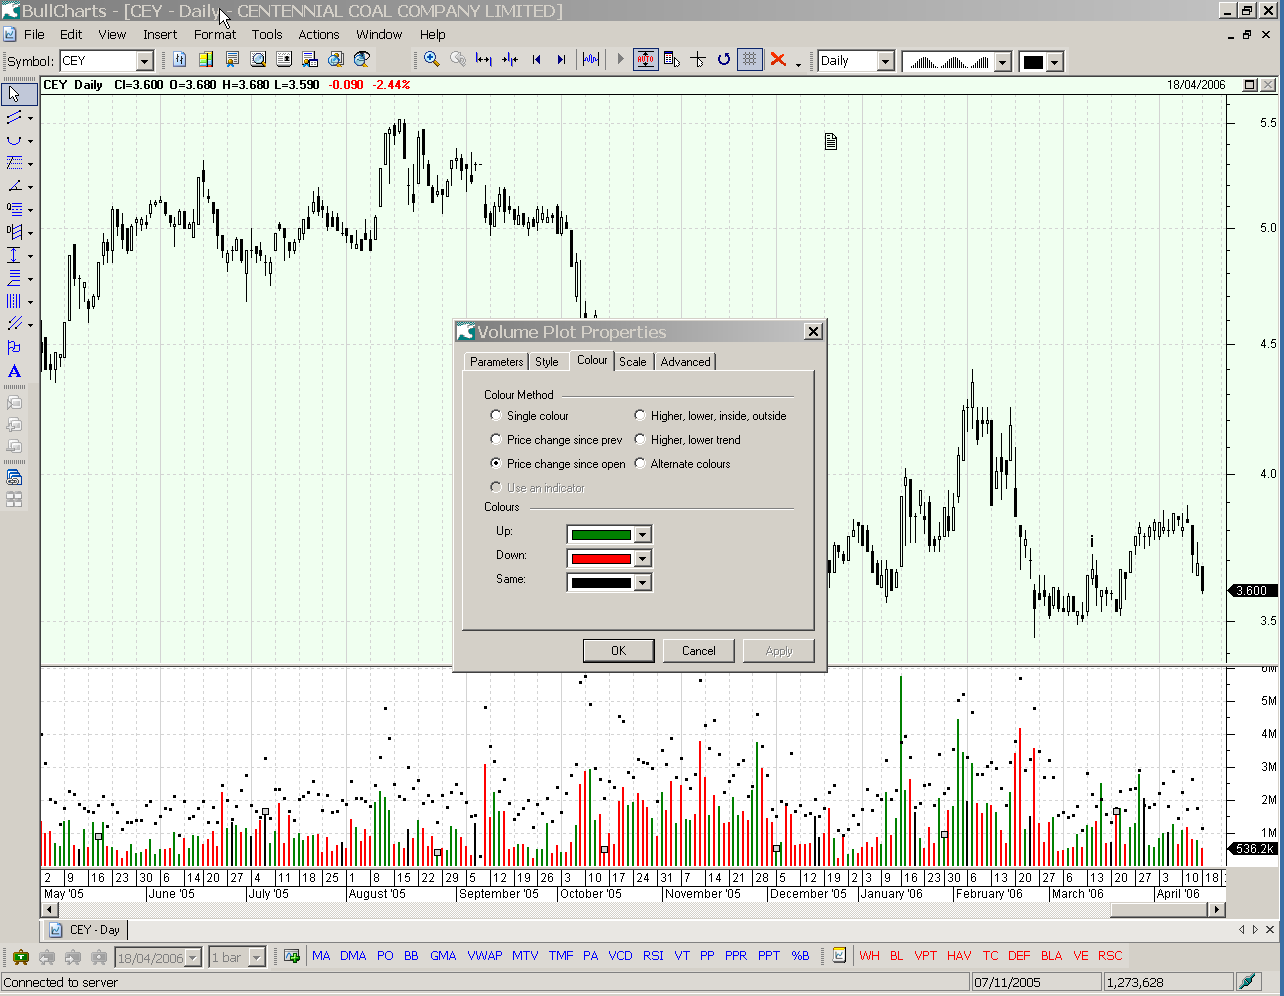
ITT,
See how I coloured the volume bars by changing the volume plot properties. I did not do any coding. You want the chart even bigger? You are kidding right? |
|
|
|
|
Post Reply
|
Page 12> |
| Forum Jump | Forum Permissions You cannot post new topics in this forum You cannot reply to topics in this forum You cannot delete your posts in this forum You cannot edit your posts in this forum You cannot create polls in this forum You cannot vote in polls in this forum |


