Coloring of an indicator |
Post Reply 
|
| Author |
 Printable Version Printable Version Delicious Delicious Digg Digg Facebook Facebook Furl Furl Google Boomarks Google Boomarks Google Buzz Google Buzz MySpace MySpace Newsvine Newsvine reddit reddit StumbleUpon Translate StumbleUpon Translate Twitter Twitter Windows Live Windows Live Yahoo Bookmarks Yahoo Bookmarks Topic Search Topic Search  Topic Options Topic Options
|
stefanols 
Newbie 

Joined: 29 Jul 2010 Location: Sweden Posts: 8 |
 Post Options Post Options
 Quote Reply Quote Reply
 Topic: Coloring of an indicator Topic: Coloring of an indicatorPosted: 27 Nov 2017 at 4:19pm |
|
Anyone? The other instrument can be anything AAPL etc. I am just after hot to color the result. I am trying to make an indicator easier to read. However it does not turn out as I would like. I would like to have plot in green when above 65, red below 35 and the rest in black. Hope that someone can assist. Thanks in advance BR Stefan [target=Default;Horzline=80,15] [tooltip= CPI Bulkowski, "36-64 Neutral, 65-100 Bullish, 1-35 Bearish,1-35"] {Calculate the realtion between bullish and bearish CPI count} symb := inputsymbol("Security","AAPL"); otherClose := LoadSymbol(symb, Close); total := close+otherclose; CPI :=(close)/total*100; CPIBU := if(CPI >= 65,CPI,undefined); CPIBE := if(CPI < 36,CPI,undefined); CPINE := if(CPI >36 or CPI>65,CPI,undefined); [linestyle=Line; width=2; color=green] CPIBU; [linestyle=Line; width=2; color=red] CPIBE; [linestyle=Line; width=2; color=black] CPINE; Edited by stefanols - 02 Dec 2017 at 8:11pm |
|
 |
|
|
maximo
BullCharts Guru 

Joined: 02 Sep 2006 Location: Australia Posts: 232 |
Post Options
Quote Reply
Posted: 11 Jan 2018 at 10:04pm |
|
An RSI(2) works as well as Bulkowski's CPI indicator on an index.
The idea is to Buy above the green line only when coming from the opposite red side. It has a 66% probability of closing in the positive for the following day only. [Description="RSI with CPI Bulkowski parameters"] n := input("Time period",2,1); nb:= n*2-1; {=wilder's smoothing } Su:=Ma(If(C-Ref(C,-1) > 0, C-Ref(C,-1), 0),nb,E); Sd:=Ma(If(C-Ref(C,-1) < 0, Ref(C,-1) - C, 0),nb,E); rs:=100-100/(1 + (Su/sd)); rs; rs1:=if(rs>=65,rs,65); rs2:=65; rs3:=if(rs<=36,rs,36); rs4:=36; [color=lime green; linestyle=dotted] 65; [color=red] 36; [name=RSI Top Fill; linestyle=fill; color=blue] rs1; rs2; [name=RSI Low Fill; linestyle=fill; color=blue] rs3; rs4; 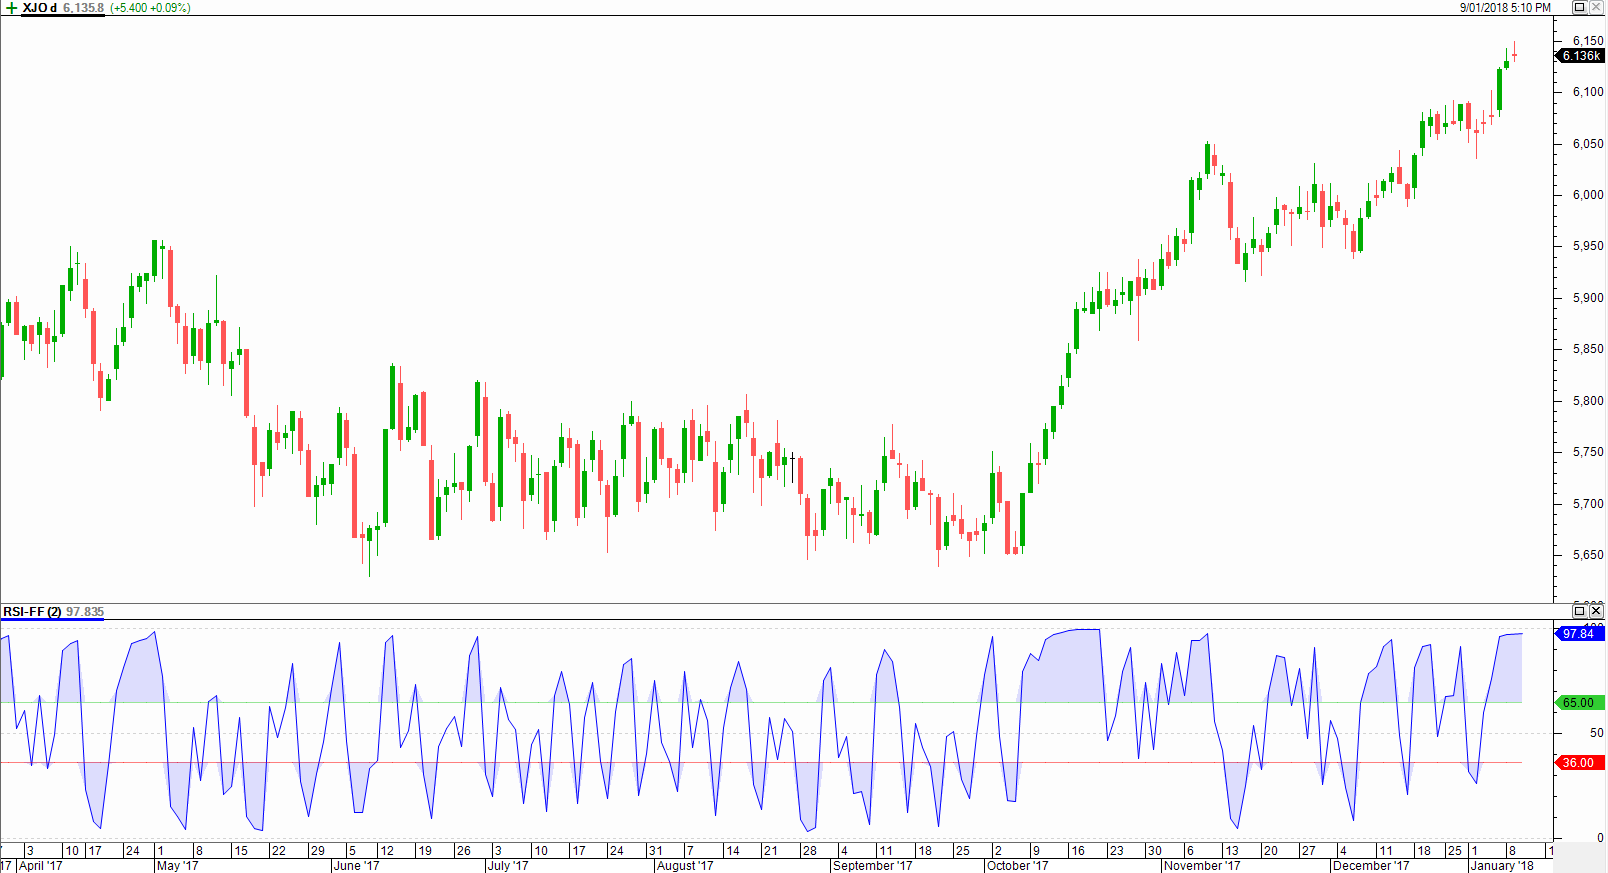 Edited by maximo - 11 Jan 2018 at 10:07pm |
|
|
|
|
stefanols
Newbie
Joined: 29 Jul 2010 Location: Sweden Posts: 8 |
Post Options
Quote Reply
Posted: 14 Jan 2018 at 2:43pm |
|
The visualisation was just what I was looking for. |
|
|
|
|
Post Reply
|
| Forum Jump | Forum Permissions You cannot post new topics in this forum You cannot reply to topics in this forum You cannot delete your posts in this forum You cannot edit your posts in this forum You cannot create polls in this forum You cannot vote in polls in this forum |


