W D Gann's Stock vibrations and market structure |
Post Reply 
|
Page <12 |
| Author |
 Printable Version Printable Version Delicious Delicious Digg Digg Facebook Facebook Furl Furl Google Boomarks Google Boomarks Google Buzz Google Buzz MySpace MySpace Newsvine Newsvine reddit reddit StumbleUpon Translate StumbleUpon Translate Twitter Twitter Windows Live Windows Live Yahoo Bookmarks Yahoo Bookmarks Topic Search Topic Search  Topic Options Topic Options
|
cmacdon 
BullCharts Guru 
Joined: 09 Sep 2012 Location: Brisbane Posts: 236 |
 Post Options Post Options
 Quote Reply Quote Reply
 Posted: 22 Aug 2014 at 8:11pm Posted: 22 Aug 2014 at 8:11pm |
10% Vibration Edited by cmacdon - 23 Aug 2014 at 8:44am |
|
|
BC User since June 2007
|
|
 |
|
|
cmacdon
BullCharts Guru
Joined: 09 Sep 2012 Location: Brisbane Posts: 236 |
Post Options
Quote Reply
Posted: 22 Aug 2014 at 8:10pm |

5% Vibration Edited by cmacdon - 23 Aug 2014 at 8:44am |
|
|
BC User since June 2007
|
|
|
|
|
cmacdon
BullCharts Guru
Joined: 09 Sep 2012 Location: Brisbane Posts: 236 |
Post Options
Quote Reply
Posted: 22 Aug 2014 at 8:07pm |

10% Vibration Edited by cmacdon - 23 Aug 2014 at 8:43am |
|
|
BC User since June 2007
|
|
|
|
|
cmacdon
BullCharts Guru
Joined: 09 Sep 2012 Location: Brisbane Posts: 236 |
Post Options
Quote Reply
Posted: 22 Aug 2014 at 8:05pm |
|
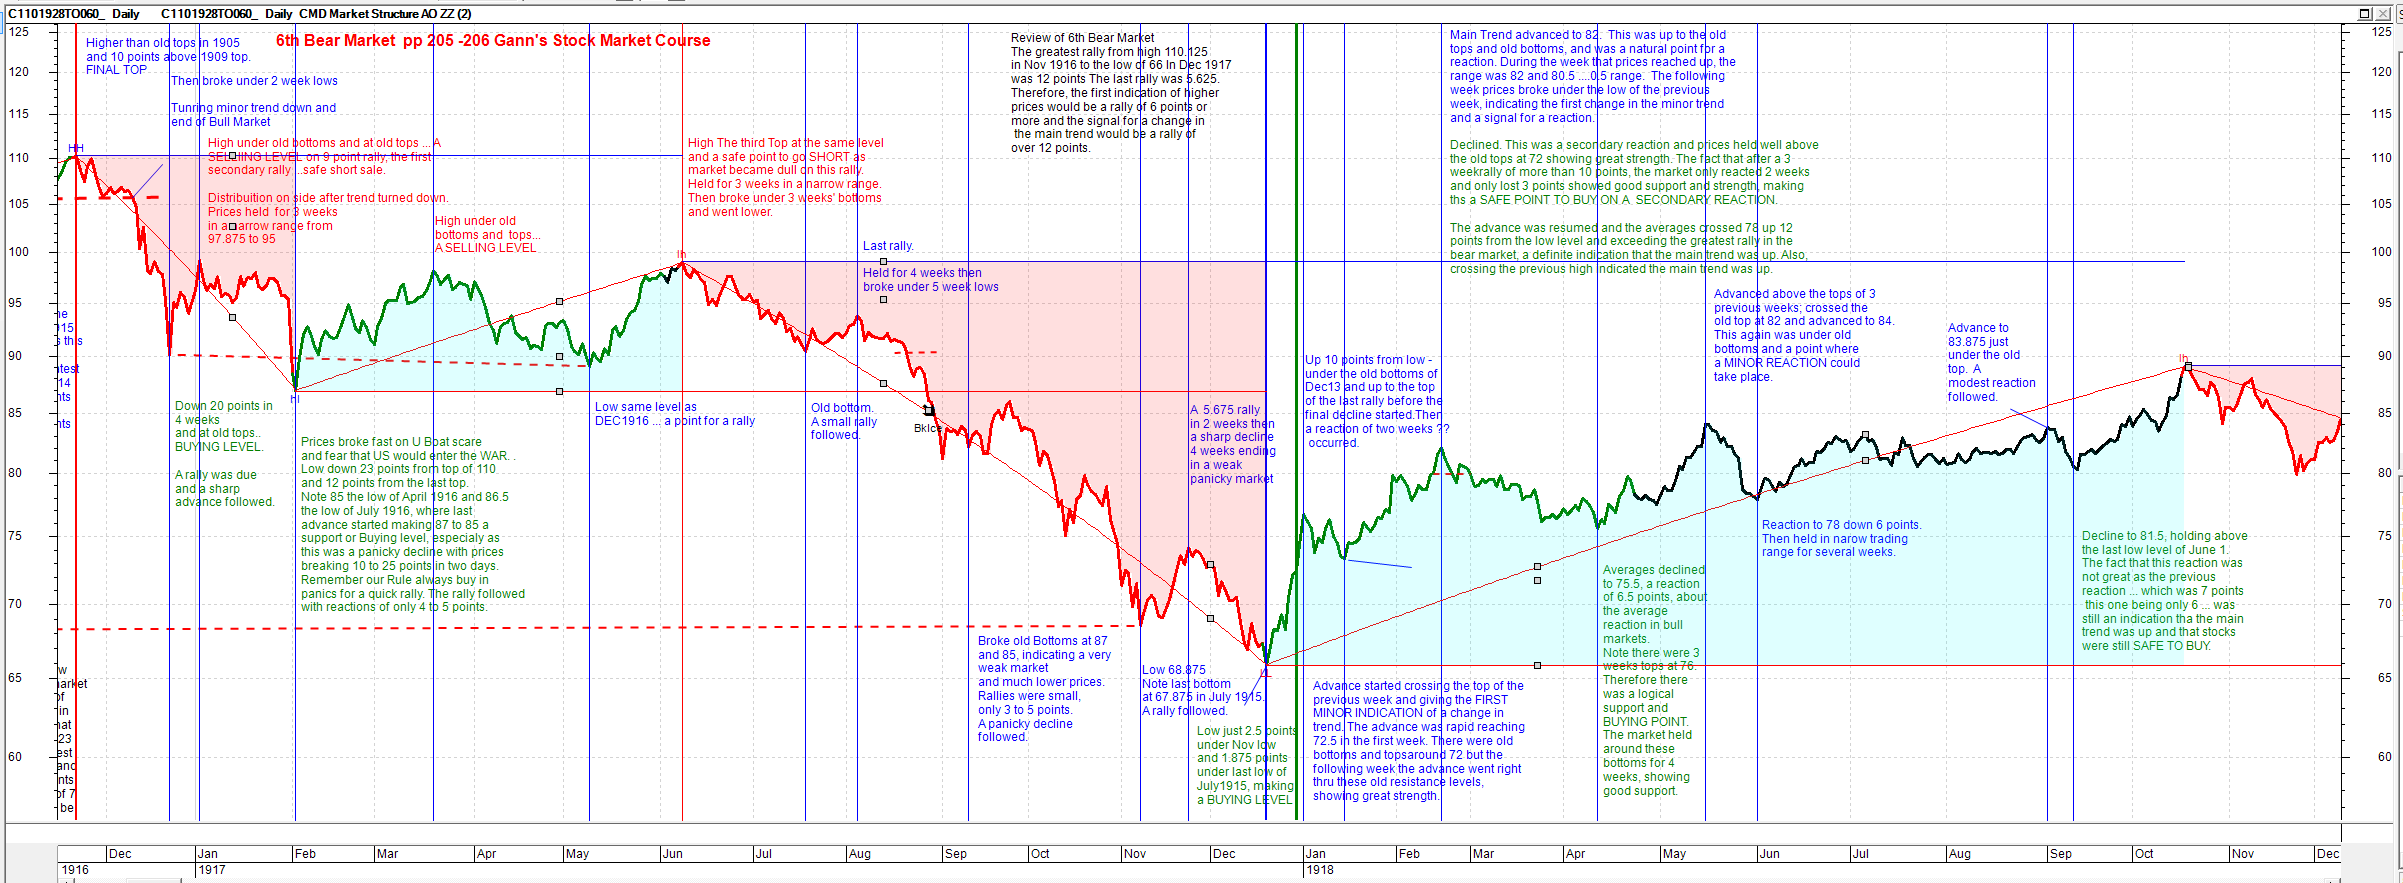
Here is a way to synthesise a few previous posts about Gann Case Studies, Market Structure and a way to focus in on W.D.Gann's concept of stocks having a particular vibration.
Gann did not really provide the formula for his vibration approach and there seem to be various hypotheses suggesting Astrological influences or Mathematical influences were the underlying basis for Gann's stock vibrations. So here is another partial concept. For this approach, I adapted a Slightly more flexible Market Structure indicator ( then previous market structure post) and applied it to the DJIA data which Gann commented on in case studies of a Bull and Bear Market campaign from 1915 to 1918 in his stock market course. I recall he did a similar case study covering later DJIA years in his book 45 Years In Wall Street. Reading the charts below, the comments relate to the point in time with a vertical line to the left of the comment. Some comments in green seem to be more general comments but they as typed exactly per the course albeit shortened comments in some instances. The qualitative verification of the appropriate vibration is being used is that the indicator set to the 5% vibration better reflects Gann's particular comments throughout the DJIA chart over the 3 years covering both the Bull and Bear campaigns. It is difficult to get further direct data for many of the other stock, commodities Gann discussed in his books and courses but DJIA data is obtainable back to the case study time. So, make up your own mind if the market structure and vibration indicator works. So,set out below is Gann's narrative for a Bull Market and Bear market campaign. I then applied either a 10% market structure indicator or a 5% indicator to the chart. The code for this Market Structure and vibration indicator is set out further below. It is same logic as previous post on Market Structure but with an alternative formula capable of picking up small or large vibrations (or %'s). Edited by cmacdon - 23 Aug 2014 at 1:42am |
|
|
BC User since June 2007
|
|
|
|
|
Post Reply
|
Page <12 |
| Forum Jump | Forum Permissions You cannot post new topics in this forum You cannot reply to topics in this forum You cannot delete your posts in this forum You cannot edit your posts in this forum You cannot create polls in this forum You cannot vote in polls in this forum |


